
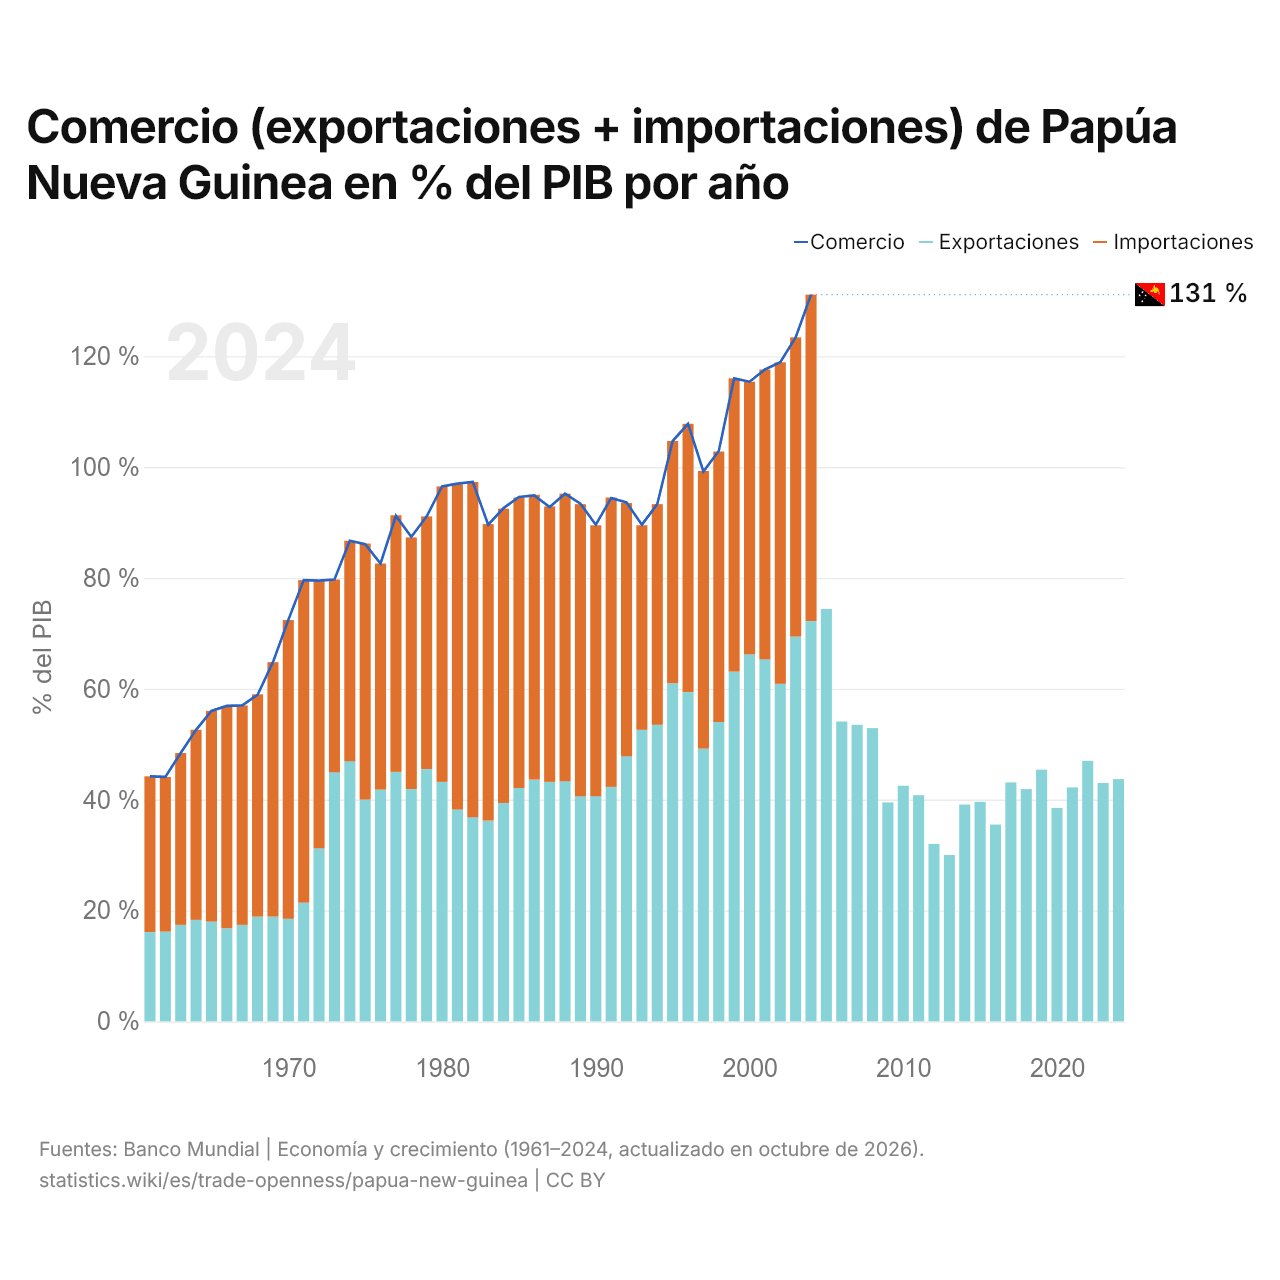
Comercio (exportaciones + importaciones) de Papúa Nueva Guinea en % del PIB por año
| Año | % del PIB | ||
|---|---|---|---|
| Exportaciones | Importaciones | Comercio | |
| 2024 | 43,7 % | - | - |
| 2023 | 43 % | - | - |
| 2022 | 47 % | - | - |
| 2021 | 42,2 % | - | - |
| 2020 | 38,5 % | - | - |
| 2019 | 45,4 % | - | - |
| 2018 | 41,9 % | - | - |
| 2017 | 43,1 % | - | - |
| 2016 | 35,5 % | - | - |
| 2015 | 39,6 % | - | - |
| 2014 | 39,1 % | - | - |
| 2013 | 30 % | - | - |
| 2012 | 32 % | - | - |
| 2011 | 40,8 % | - | - |
| 2010 | 42,5 % | - | - |
| 2009 | 39,5 % | - | - |
| 2008 | 52,9 % | - | - |
| 2007 | 53,5 % | - | - |
| 2006 | 54,1 % | - | - |
| 2005 | 74,4 % | - | - |
| 2004 | 72,2 % | 58,9 % | 131,1 % |
| 2003 | 69,4 % | 54 % | 123,4 % |
| 2002 | 60,9 % | 58 % | 118,9 % |
| 2001 | 65,3 % | 52,3 % | 117,6 % |
| 2000 | 66,2 % | 49,2 % | 115,4 % |
| 1999 | 63,1 % | 52,9 % | 116 % |
| 1998 | 54 % | 48,8 % | 102,9 % |
| 1997 | 49,2 % | 50,1 % | 99,2 % |
| 1996 | 59,4 % | 48,4 % | 107,8 % |
| 1995 | 61 % | 43,7 % | 104,7 % |
| 1994 | 53,5 % | 39,8 % | 93,3 % |
| 1993 | 52,6 % | 36,9 % | 89,6 % |
| 1992 | 47,8 % | 45,7 % | 93,6 % |
| 1991 | 42,3 % | 52,2 % | 94,4 % |
| 1990 | 40,6 % | 48,9 % | 89,6 % |
| 1989 | 40,6 % | 52,7 % | 93,4 % |
| 1988 | 43,3 % | 51,9 % | 95,2 % |
| 1987 | 43,2 % | 49,7 % | 92,8 % |
| 1986 | 43,6 % | 51,4 % | 94,9 % |
| 1985 | 42,1 % | 52,4 % | 94,6 % |
| 1984 | 39,4 % | 53,1 % | 92,6 % |
| 1983 | 36,2 % | 53,5 % | 89,6 % |
| 1982 | 36,8 % | 60,5 % | 97,3 % |
| 1981 | 38,2 % | 58,7 % | 97 % |
| 1980 | 43,2 % | 53,3 % | 96,5 % |
| 1979 | 45,5 % | 45,6 % | 91,1 % |
| 1978 | 41,9 % | 45,4 % | 87,4 % |
| 1977 | 45 % | 46,3 % | 91,2 % |
| 1976 | 41,8 % | 40,8 % | 82,6 % |
| 1975 | 40 % | 46,2 % | 86,1 % |
| 1974 | 46,9 % | 39,8 % | 86,7 % |
| 1973 | 44,9 % | 34,8 % | 79,7 % |
| 1972 | 31,2 % | 48,2 % | 79,5 % |
| 1971 | 21,4 % | 58,2 % | 79,6 % |
| 1970 | 18,5 % | 53,9 % | 72,4 % |
| 1969 | 18,9 % | 45,9 % | 64,8 % |
| 1968 | 18,9 % | 40,1 % | 58,9 % |
| 1967 | 17,4 % | 39,6 % | 57 % |
| 1966 | 16,8 % | 40,1 % | 56,9 % |
| 1965 | 18 % | 38 % | 56 % |
| 1964 | 18,3 % | 34,3 % | 52,6 % |
| 1963 | 17,4 % | 31 % | 48,4 % |
| 1962 | 16,2 % | 27,9 % | 44,1 % |
| 1961 | 16,1 % | 28,1 % | 44,2 % |
El comercio de Papúa Nueva Guinea equivale al 131,1 % de su PIB (2004), frente al 44,2 % en 1961. Su mínimo fue del 44,1 %, en 1962. Las exportaciones representan el 72,2 % del PIB (2004) y las importaciones, el 58,9 %.
La mayor subida del comercio de Papúa Nueva Guinea en diez años fue la de 1990 a 2000, de 25,8 puntos porcentuales del PIB; la mayor caída, la de 1980 a 1990, de 6,9 puntos.
Comparar la apertura comercial de Papúa Nueva Guinea con otros países
Fuentes:
- Banco Mundial | Economía y crecimiento (1961–2024, actualizado en octubre de 2026)
Creative Commons Atribución (CC BY): puedes copiar, compartir, adaptar y reutilizar este contenido, también con fines comerciales, siempre que cites a statistics.wiki e indiques los cambios que hayas hecho. Las fuentes indicadas arriba pueden tener sus propias condiciones de licencia.