
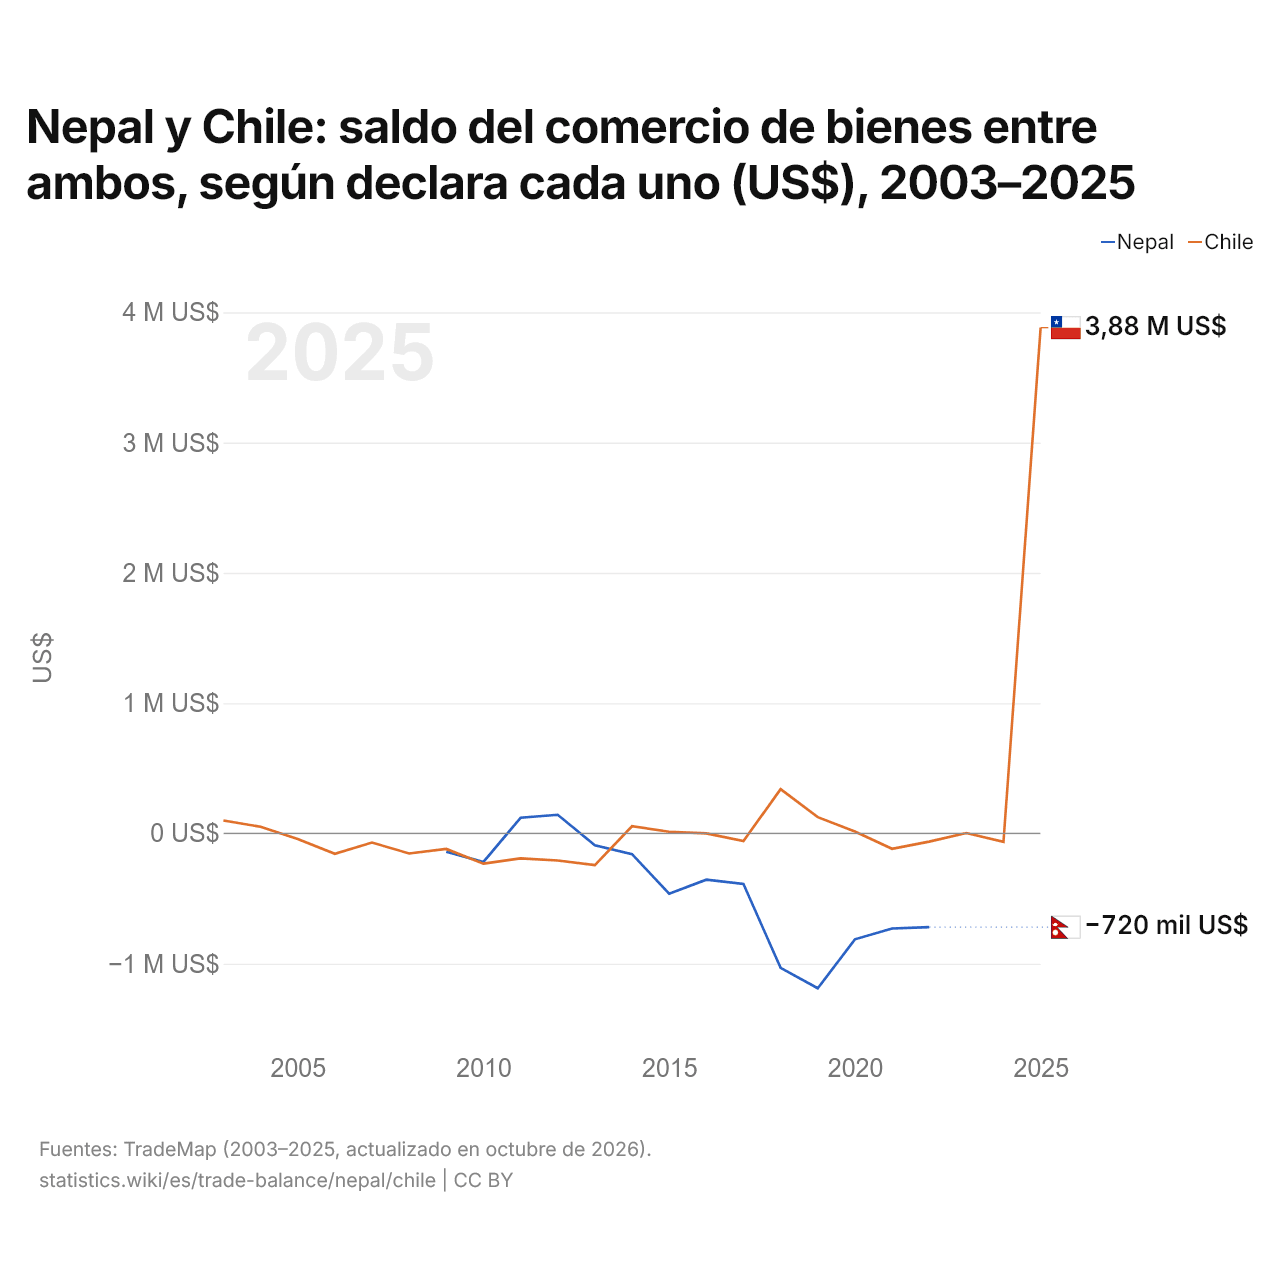
Nepal y Chile: saldo del comercio de bienes entre ambos, según declara cada uno (US$), 2003–2025
| Año | US$ | |
|---|---|---|
| Nepal | Chile | |
| 2025 | - | 3.882.000 US$ |
| 2024 | - | −65.000 US$ |
| 2023 | - | 3.000 US$ |
| 2022 | −720.000 US$ | −63.000 US$ |
| 2021 | −730.000 US$ | −118.000 US$ |
| 2020 | −813.000 US$ | 14.000 US$ |
| 2019 | −1.189.000 US$ | 125.000 US$ |
| 2018 | −1.032.000 US$ | 340.000 US$ |
| 2017 | −388.000 US$ | −59.000 US$ |
| 2016 | −355.000 US$ | 0 US$ |
| 2015 | −463.000 US$ | 13.000 US$ |
| 2014 | −159.000 US$ | 55.000 US$ |
| 2013 | −91.000 US$ | −244.000 US$ |
| 2012 | 143.000 US$ | −208.000 US$ |
| 2011 | 120.000 US$ | −192.000 US$ |
| 2010 | −219.000 US$ | −232.000 US$ |
| 2009 | −140.000 US$ | −119.000 US$ |
| 2008 | - | −154.000 US$ |
| 2007 | - | −70.000 US$ |
| 2006 | - | −157.000 US$ |
| 2005 | - | −43.000 US$ |
| 2004 | - | 51.000 US$ |
| 2003 | - | 99.000 US$ |
Según Nepal, su comercio de bienes con Chile tuvo un déficit de 720.000 US$; según Chile, su comercio de bienes con Nepal tuvo un déficit de 63.000 US$. En 2009, las cifras fueron un déficit de 140.000 US$ de Nepal y un déficit de 119.000 US$ de Chile.
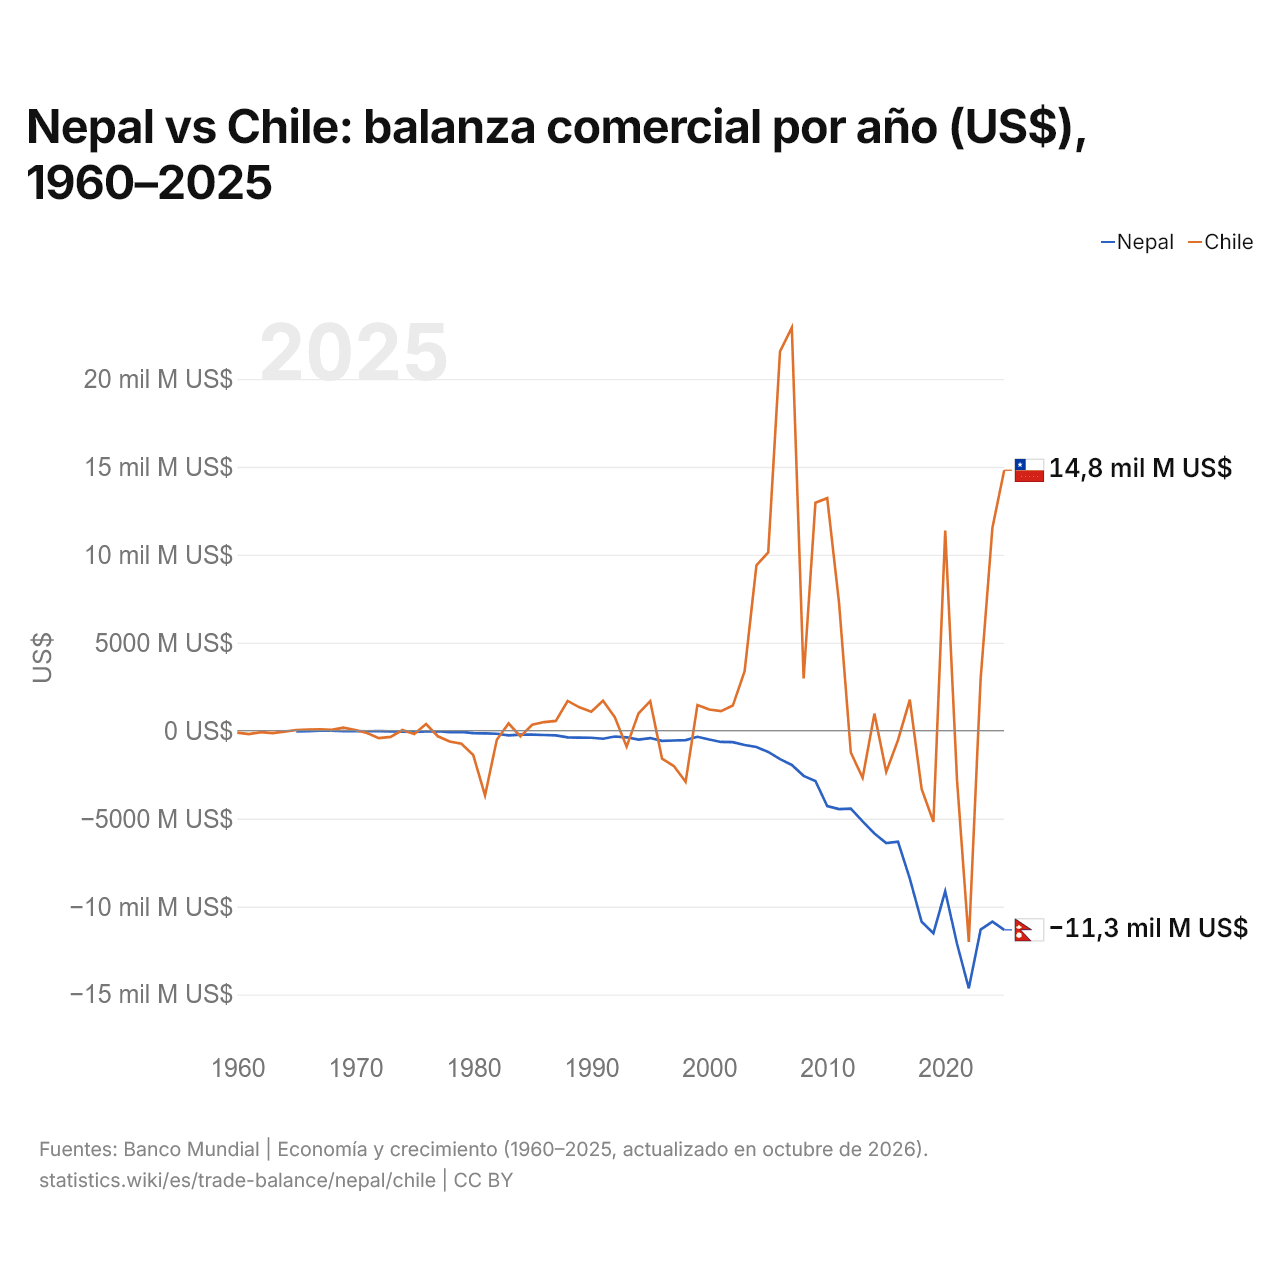
Nepal vs Chile: balanza comercial por año (US$), 1960–2025
| Año | US$ | |
|---|---|---|
 Nepal |
 Chile |
|
| 2025 | −11.325.496.917 US$ | 14.804.975.228 US$ |
| 2024 | −10.851.375.469 US$ | 11.545.176.279 US$ |
| 2023 | −11.312.462.877 US$ | 2.933.166.506 US$ |
| 2022 | −14.648.203.159 US$ | −12.014.002.658 US$ |
| 2021 | −12.117.057.230 US$ | −2.812.122.188 US$ |
| 2020 | −9.130.156.432 US$ | 11.375.796.052 US$ |
| 2019 | −11.517.205.870 US$ | −5.182.833.879 US$ |
| 2018 | −10.865.912.856 US$ | −3.310.530.298 US$ |
| 2017 | −8.406.985.329 US$ | 1.757.984.593 US$ |
| 2016 | −6.316.510.579 US$ | −527.476.210 US$ |
| 2015 | −6.391.434.590 US$ | −2.344.379.586 US$ |
| 2014 | −5.849.879.970 US$ | 968.625.055 US$ |
| 2013 | −5.158.487.757 US$ | −2.686.187.876 US$ |
| 2012 | −4.432.060.436 US$ | −1.241.559.881 US$ |
| 2011 | −4.462.444.951 US$ | 7.284.859.134 US$ |
| 2010 | −4.291.885.800 US$ | 13.219.086.595 US$ |
| 2009 | −2.859.043.816 US$ | 12.961.051.576 US$ |
| 2008 | −2.569.878.630 US$ | 2.965.553.776 US$ |
| 2007 | −1.948.231.956 US$ | 22.911.435.530 US$ |
| 2006 | −1.616.003.938 US$ | 21.568.421.478 US$ |
| 2005 | −1.211.048.644 US$ | 10.136.483.837 US$ |
| 2004 | −929.747.245 US$ | 9.394.522.805 US$ |
| 2003 | −813.348.972 US$ | 3.387.497.528 US$ |
| 2002 | −650.860.003 US$ | 1.426.773.699 US$ |
| 2001 | −641.455.782 US$ | 1.109.305.458 US$ |
| 2000 | −502.316.491 US$ | 1.202.974.079 US$ |
| 1999 | −345.813.098 US$ | 1.453.087.040 US$ |
| 1998 | −537.368.846 US$ | −2.909.838.412 US$ |
| 1997 | −559.740.487 US$ | −2.009.169.758 US$ |
| 1996 | −579.784.999 US$ | −1.587.287.186 US$ |
| 1995 | −420.050.227 US$ | 1.678.472.004 US$ |
| 1994 | −506.077.551 US$ | 975.504.071 US$ |
| 1993 | −377.850.000 US$ | −910.684.560 US$ |
| 1992 | −332.501.114 US$ | 767.144.020 US$ |
| 1991 | −458.559.867 US$ | 1.706.007.584 US$ |
| 1990 | −403.897.488 US$ | 1.074.813.125 US$ |
| 1989 | −395.379.411 US$ | 1.325.335.767 US$ |
| 1988 | −381.294.038 US$ | 1.690.789.705 US$ |
| 1987 | −268.913.256 US$ | 555.122.127 US$ |
| 1986 | −246.320.174 US$ | 488.799.123 US$ |
| 1985 | −221.916.059 US$ | 339.874.219 US$ |
| 1984 | −227.059.769 US$ | −326.526.915 US$ |
| 1983 | −271.247.885 US$ | 412.516.962 US$ |
| 1982 | −172.846.486 US$ | −515.371.499 US$ |
| 1981 | −152.833.342 US$ | −3.683.471.885 US$ |
| 1980 | −139.916.667 US$ | −1.387.218.822 US$ |
| 1979 | −77.416.683 US$ | −745.793.488 US$ |
| 1978 | −78.614.682 US$ | −613.837.751 US$ |
| 1977 | −34.960.000 US$ | −320.362.052 US$ |
| 1976 | −49.445.265 US$ | 375.782.332 US$ |
| 1975 | −70.368.962 US$ | −187.399.628 US$ |
| 1974 | −62.095.863 US$ | 37.116.935 US$ |
| 1973 | −36.567.171 US$ | −351.014.126 US$ |
| 1972 | −23.111.102 US$ | −426.238.589 US$ |
| 1971 | −32.888.889 US$ | −131.010.402 US$ |
| 1970 | −29.432.099 US$ | 35.341.639 US$ |
| 1969 | −25.283.951 US$ | 168.513.808 US$ |
| 1968 | −5.059.929 US$ | 43.189.791 US$ |
| 1967 | −656.254 US$ | 80.542.423 US$ |
| 1966 | −28.218.926 US$ | 67.017.398 US$ |
| 1965 | −45.281.533 US$ | 38.087.742 US$ |
| 1964 | - | −58.309.926 US$ |
| 1963 | - | −138.188.656 US$ |
| 1962 | - | −81.469.754 US$ |
| 1961 | - | −198.972.381 US$ |
| 1960 | - | −114.140.000 US$ |
En 2025, la balanza comercial de Nepal tuvo un déficit de 11,3 mil millones de US$ y la de Chile, un superávit de 14,8 mil millones de US$. En 1965, la balanza comercial de Nepal tuvo un déficit de 45,3 millones de US$ y la de Chile, un superávit de 38,1 millones de US$.
De 1965 a 2025, la balanza comercial de Nepal tuvo superávit en ninguno de los 61 años, y la de Chile, en 38. Las balanzas comerciales de Nepal y de Chile tuvieron déficit a la vez en 23 de esos años, el más reciente en 2022.
Nepal vs Chile: cifras de la balanza comercial
|
Nepal
|
Chile
|
|
|---|---|---|
| Bienes y servicios, US$ | −11,3 mil M US$ (2025) | +14,8 mil M US$ (2025) |
| % del PIB | −24,9 % (2025) | +4,1 % (2025) |
| Años con superávit desde 2000 | 0 de 26 | 18 de 26 |
| Saldo de bienes entre ambos, cifras propias | −720 mil US$ (2022) | +3,88 M US$ (2025) |
| Mayor superávit en bienes con | Dinamarca (+3,63 M US$, 2022) | China (+15,1 mil M US$, 2025) |
| Mayor déficit en bienes con | India (−7730 M US$, 2022) | Argentina (−5550 M US$, 2025) |
Comparar la balanza comercial de 2 países cualesquiera
Fuentes:
- Banco Mundial | Economía y crecimiento (1960–2025, actualizado en octubre de 2026)
- TradeMap (2003–2025, actualizado en octubre de 2026)
Creative Commons Atribución (CC BY): puedes copiar, compartir, adaptar y reutilizar este contenido, también con fines comerciales, siempre que cites a statistics.wiki e indiques los cambios que hayas hecho. Las fuentes indicadas arriba pueden tener sus propias condiciones de licencia.