
Pakistán vs Argentina: capitalización bursátil por año (US$), 1977–2025
| Año | US$ | |
|---|---|---|
 Pakistán |
 Argentina |
|
| 2025 | 70.289.650.000 US$ | - |
| 2024 | 52.073.620.000 US$ | - |
| 2023 | 32.255.770.000 US$ | - |
| 2022 | 28.713.900.000 US$ | 52.947.830.000 US$ |
| 2021 | 43.096.600.000 US$ | 41.751.170.000 US$ |
| 2020 | 50.278.510.000 US$ | 32.250.420.000 US$ |
| 2019 | 50.561.890.000 US$ | 39.393.540.000 US$ |
| 2018 | 55.503.510.000 US$ | 45.986.050.000 US$ |
| 2017 | - | 108.740.050.000 US$ |
| 2016 | - | 63.601.116.144 US$ |
| 2015 | - | 56.134.630.000 US$ |
| 2014 | - | 60.142.040.000 US$ |
| 2013 | - | 53.104.790.000 US$ |
| 2012 | - | 34.254.750.000 US$ |
| 2011 | 32.567.930.000 US$ | 43.579.790.000 US$ |
| 2010 | 38.007.180.000 US$ | 63.909.790.000 US$ |
| 2009 | 31.886.980.000 US$ | 45.744.930.000 US$ |
| 2008 | 23.354.040.000 US$ | 39.850.360.000 US$ |
| 2007 | 69.715.390.000 US$ | 57.070.160.000 US$ |
| 2006 | 44.906.480.000 US$ | 51.240.130.000 US$ |
| 2005 | 45.317.280.000 US$ | 47.590.300.000 US$ |
| 2004 | 45.595.630.000 US$ | 40.593.870.000 US$ |
| 2003 | - | 34.994.620.000 US$ |
| 2002 | - | 16.571.000.000 US$ |
| 2001 | 4.903.400.000 US$ | 33.384.000.000 US$ |
| 2000 | 6.624.600.000 US$ | 45.839.340.000 US$ |
| 1999 | 7.007.800.000 US$ | 55.847.580.000 US$ |
| 1998 | 5.418.610.000 US$ | 45.332.800.000 US$ |
| 1997 | 11.805.320.000 US$ | 59.251.850.000 US$ |
| 1996 | 11.660.460.000 US$ | 44.692.350.000 US$ |
| 1995 | 9.459.210.000 US$ | 37.783.780.000 US$ |
| 1994 | 12.927.800.000 US$ | 36.867.200.000 US$ |
| 1993 | 12.651.700.000 US$ | 44.055.310.000 US$ |
| 1992 | - | 18.623.100.000 US$ |
| 1991 | - | 18.639.700.000 US$ |
| 1990 | - | 3.615.300.000 US$ |
| 1989 | - | 3.197.870.000 US$ |
| 1988 | - | 2.552.540.000 US$ |
| 1987 | - | 1.418.130.000 US$ |
| 1986 | - | 1.590.930.000 US$ |
| 1985 | - | 2.035.830.000 US$ |
| 1984 | - | 1.170.700.000 US$ |
| 1983 | - | 1.386.290.000 US$ |
| 1982 | - | 972.900.000 US$ |
| 1981 | - | 1.396.230.000 US$ |
| 1980 | - | 3.954.900.000 US$ |
| 1979 | - | 4.319.860.000 US$ |
| 1978 | - | 1.795.400.000 US$ |
| 1977 | - | 832.500.000 US$ |
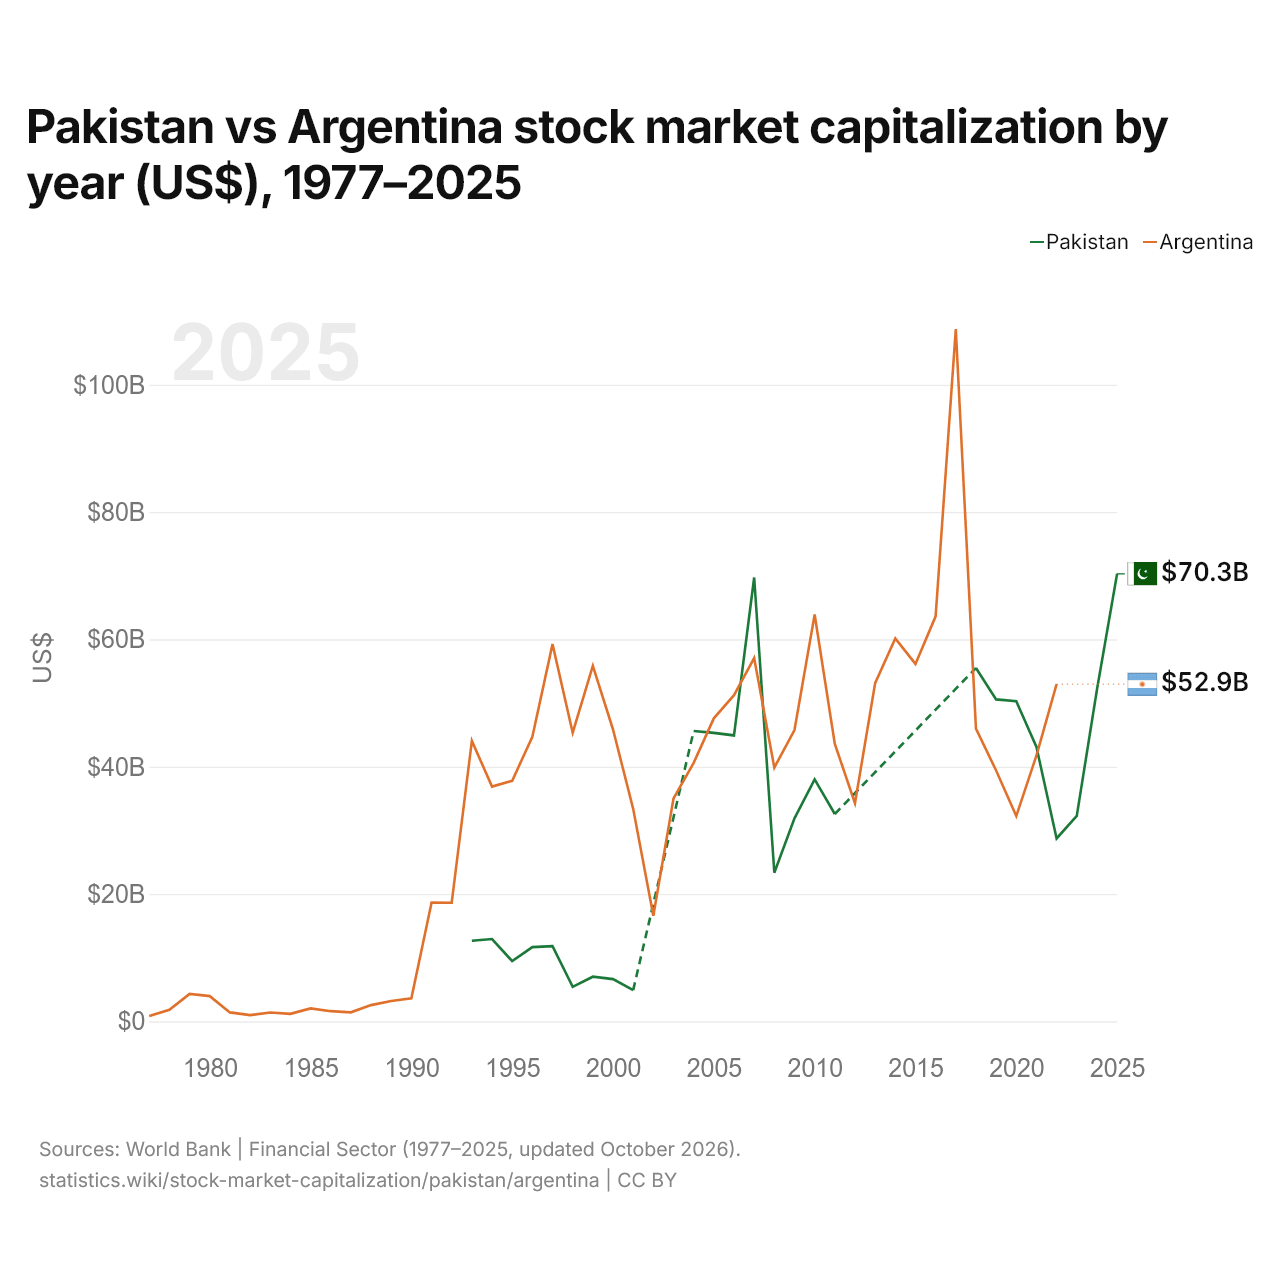
El valor de las empresas cotizadas fue de 28,7 mil millones de US$ en Pakistán (2022) y de 52,9 mil millones de US$ en Argentina (2022): 1,8 veces más en Argentina. En 1993, el valor de las empresas cotizadas fue 3,5 veces mayor en Argentina: 12,7 mil millones de US$ en Pakistán y 44,1 mil millones de US$ en Argentina.
Pakistán vs Argentina: capitalización bursátil, % del PIB por año, 1977–2025
| Año | % del PIB | |
|---|---|---|
|
Pakistán
|
Argentina
|
|
| 2025 | 17,3 % | - |
| 2024 | 14 % | - |
| 2023 | 9,6 % | - |
| 2022 | 7,7 % | 8,4 % |
| 2021 | 12,4 % | 8,6 % |
| 2020 | 16,7 % | 8,4 % |
| 2019 | 15,8 % | 8,8 % |
| 2018 | 15,6 % | 8,8 % |
| 2017 | - | 16,9 % |
| 2016 | - | 11,4 % |
| 2015 | - | 9,4 % |
| 2014 | - | 11,4 % |
| 2013 | - | 9,6 % |
| 2012 | - | 6,3 % |
| 2011 | 14,1 % | 8,2 % |
| 2010 | 19,3 % | 15,1 % |
| 2009 | 17 % | 13,7 % |
| 2008 | 11,5 % | 11 % |
| 2007 | 37,9 % | 19,8 % |
| 2006 | 27,7 % | 22 % |
| 2005 | 31,2 % | 23,9 % |
| 2004 | 34,5 % | 24,7 % |
| 2003 | - | 27,4 % |
| 2002 | - | 17 % |
| 2001 | 5 % | 12,4 % |
| 2000 | 6,7 % | 16,1 % |
| 1999 | 11,1 % | 19,7 % |
| 1998 | 8,7 % | 15,2 % |
| 1997 | 18,9 % | 20,2 % |
| 1996 | 18,4 % | 16,4 % |
| 1995 | 15,6 % | 14,6 % |
| 1994 | 24,7 % | 14,3 % |
| 1993 | 24,4 % | 18,6 % |
| 1992 | - | 8,1 % |
| 1991 | - | 9,8 % |
| 1990 | - | 2,6 % |
| 1989 | - | 4,2 % |
| 1988 | - | 2 % |
| 1987 | - | 1,3 % |
| 1986 | - | 1,5 % |
| 1985 | - | 2,3 % |
| 1984 | - | 1 % |
| 1983 | - | 1,3 % |
| 1982 | - | 1,2 % |
| 1981 | - | 1,8 % |
| 1980 | - | 5,1 % |
| 1979 | - | 6,2 % |
| 1978 | - | 2 % |
| 1977 | - | 1,5 % |
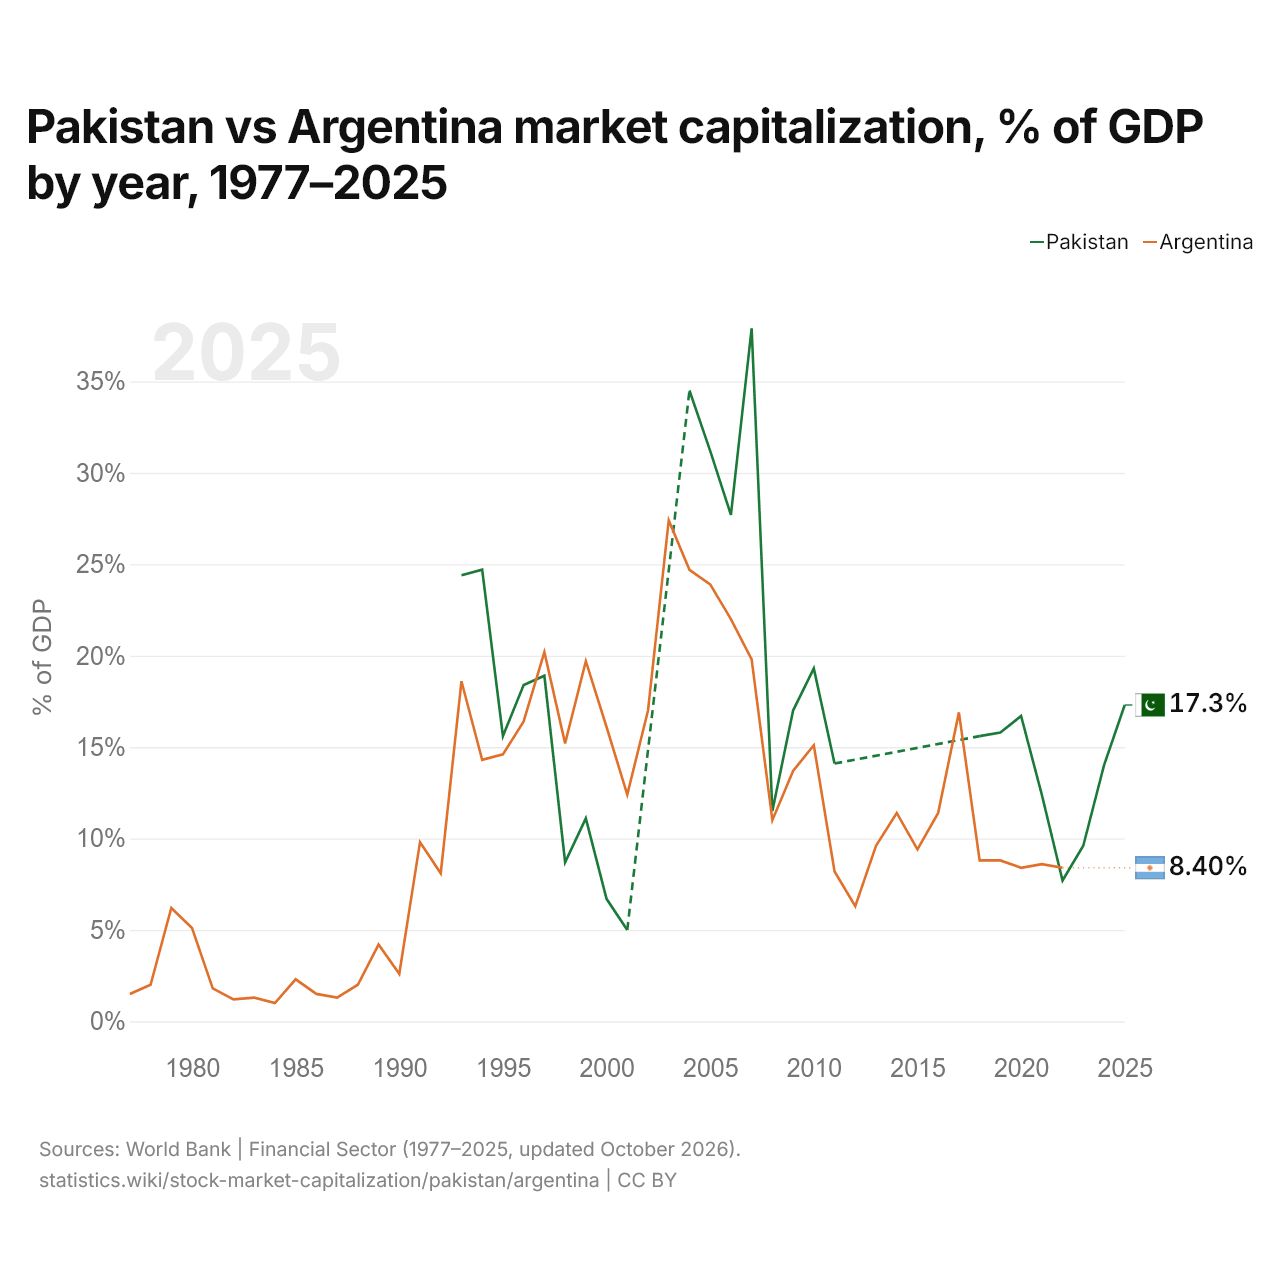
La capitalización bursátil equivalió al 7,7 % del PIB en Pakistán (2022) y al 8,4 % en Argentina (2022): 0,7 puntos porcentuales más en Argentina. En 2011, los porcentajes eran del 14,1 % en Pakistán y del 8,2 % en Argentina, 5,9 puntos porcentuales más en Pakistán.
Pakistán vs Argentina: última capitalización bursátil y empresas cotizadas
|
Pakistán
|
Argentina
|
|
|---|---|---|
| Capitalización bursátil | 70,3 mil M US$ (2025) | 52,9 mil M US$ (2022) |
| % del PIB | 17,3 % (2025) | 8,4 % (2022) |
| Empresas nacionales cotizadas | 535 (2025) | 85 (2021) |
| Puesto mundial | 40/77 | 45/77 |
Comparar la capitalización bursátil de 2 países cualesquiera
Fuentes:
- Banco Mundial | Sector financiero (1977–2025, actualizado en octubre de 2026)
Creative Commons Atribución (CC BY): puedes copiar, compartir, adaptar y reutilizar este contenido, también con fines comerciales, siempre que cites a statistics.wiki e indiques los cambios que hayas hecho. Las fuentes indicadas arriba pueden tener sus propias condiciones de licencia.