
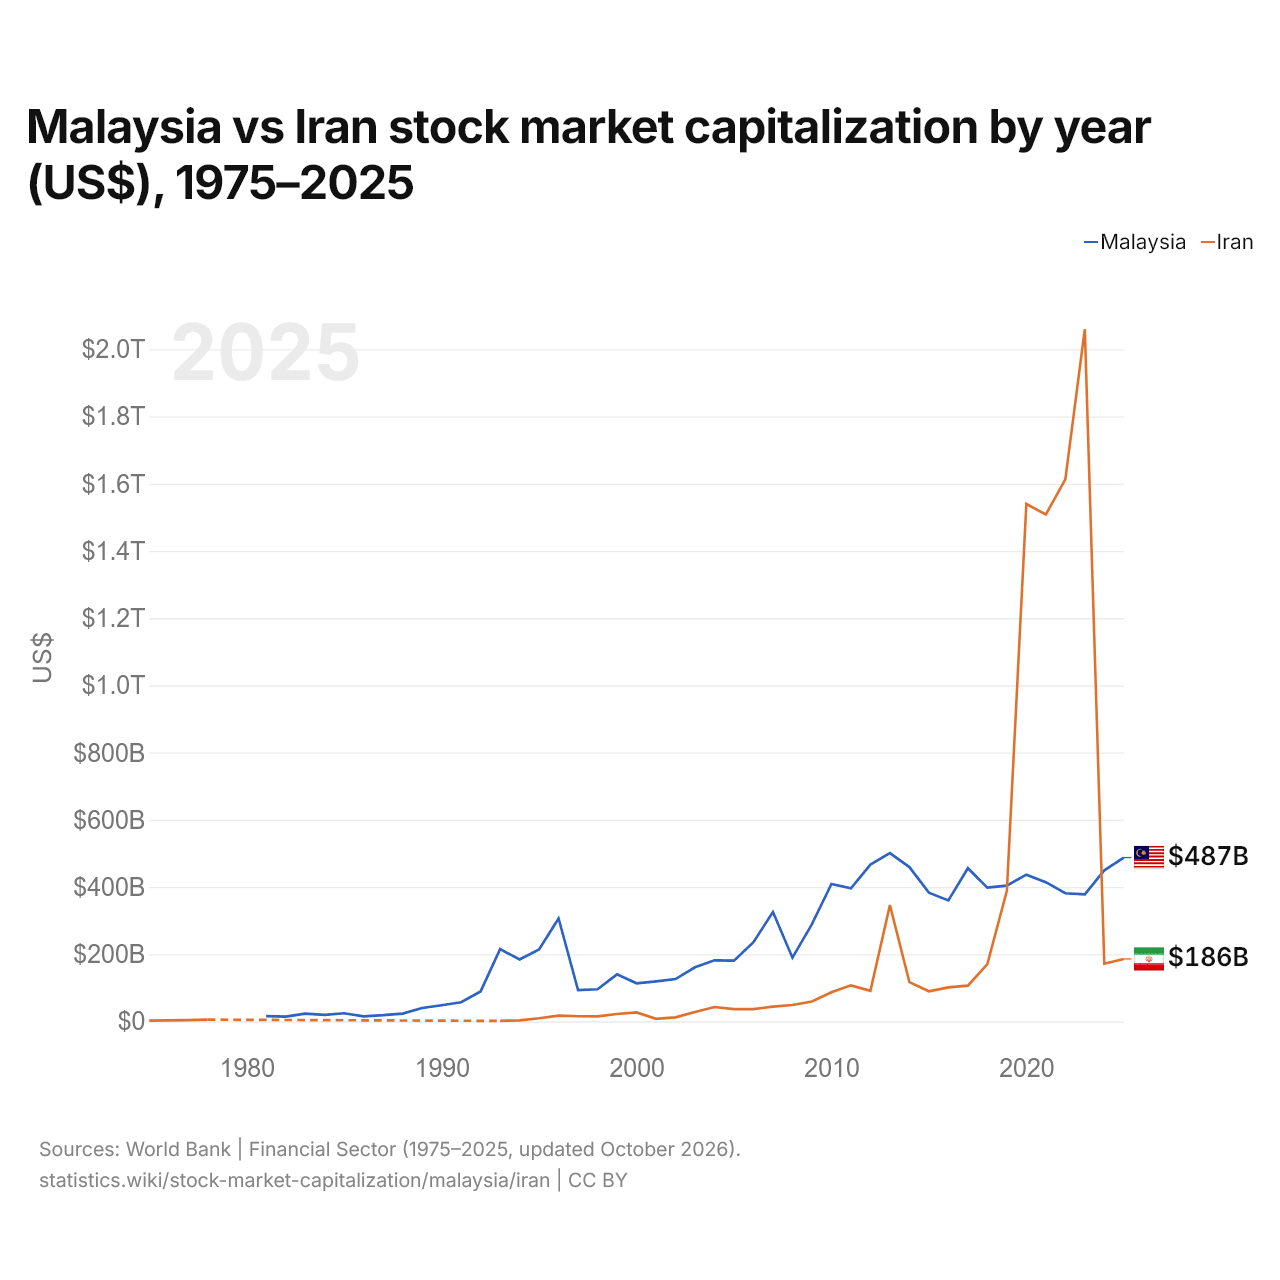
Malasia vs Irán: capitalización bursátil por año (US$), 1975–2025
| Año | US$ | |
|---|---|---|
 Malasia |
 Irán |
|
| 2025 | 487.447.470.000 US$ | 185.635.780.000 US$ |
| 2024 | 449.470.390.000 US$ | 171.583.580.000 US$ |
| 2023 | 378.054.620.000 US$ | 2.059.638.860.000 US$ |
| 2022 | 381.207.160.000 US$ | 1.613.044.750.000 US$ |
| 2021 | 414.285.260.000 US$ | 1.508.229.410.000 US$ |
| 2020 | 436.537.870.000 US$ | 1.539.564.820.000 US$ |
| 2019 | 403.957.380.000 US$ | 388.666.940.000 US$ |
| 2018 | 398.018.700.000 US$ | 170.460.420.000 US$ |
| 2017 | 455.772.490.000 US$ | 106.329.000.000 US$ |
| 2016 | 359.788.303.781 US$ | 101.008.000.000 US$ |
| 2015 | 382.976.650.000 US$ | 89.428.040.000 US$ |
| 2014 | 459.004.370.000 US$ | 116.638.450.000 US$ |
| 2013 | 500.387.410.000 US$ | 345.776.630.000 US$ |
| 2012 | 466.587.570.000 US$ | 90.995.750.000 US$ |
| 2011 | 395.623.820.000 US$ | 107.089.650.000 US$ |
| 2010 | 408.689.120.000 US$ | 86.641.520.000 US$ |
| 2009 | 289.219.390.000 US$ | 59.183.540.000 US$ |
| 2008 | 189.239.210.000 US$ | 48.712.710.000 US$ |
| 2007 | 325.290.260.000 US$ | 43.885.010.000 US$ |
| 2006 | 235.580.900.000 US$ | 36.314.580.000 US$ |
| 2005 | 180.517.540.000 US$ | 36.440.220.000 US$ |
| 2004 | 181.623.790.000 US$ | 42.600.420.000 US$ |
| 2003 | 160.814.200.000 US$ | 27.544.170.000 US$ |
| 2002 | 125.778.160.000 US$ | 11.760.560.000 US$ |
| 2001 | 118.980.790.000 US$ | 7.381.240.000 US$ |
| 2000 | 113.155.790.000 US$ | 26.685.660.000 US$ |
| 1999 | 139.907.890.000 US$ | 21.827.030.000 US$ |
| 1998 | 95.561.430.000 US$ | 14.903.260.000 US$ |
| 1997 | 93.230.310.000 US$ | 15.181.250.000 US$ |
| 1996 | 306.164.190.000 US$ | 17.024.440.000 US$ |
| 1995 | 213.755.810.000 US$ | 9.161.700.000 US$ |
| 1994 | 184.023.500.000 US$ | 2.803.000.000 US$ |
| 1993 | 214.726.800.000 US$ | 1.286.800.000 US$ |
| 1992 | 89.008.100.000 US$ | - |
| 1991 | 56.721.200.000 US$ | - |
| 1990 | 47.868.790.000 US$ | - |
| 1989 | 39.696.180.000 US$ | - |
| 1988 | 23.056.220.000 US$ | - |
| 1987 | 18.252.570.000 US$ | - |
| 1986 | 14.861.230.000 US$ | - |
| 1985 | 24.153.930.000 US$ | - |
| 1984 | 19.333.650.000 US$ | - |
| 1983 | 22.699.050.000 US$ | - |
| 1982 | 13.877.610.000 US$ | - |
| 1981 | 15.298.580.000 US$ | - |
| 1980 | - | - |
| 1979 | - | - |
| 1978 | - | 5.001.760.000 US$ |
| 1977 | - | 3.814.710.000 US$ |
| 1976 | - | 3.100.000.000 US$ |
| 1975 | - | 1.900.010.000 US$ |
En 2025, el valor de las empresas cotizadas fue de 487 mil millones de US$ en Malasia y de 186 mil millones de US$ en Irán: 2,6 veces más en Malasia. En 1993, el valor de las empresas cotizadas fue 170 veces mayor en Malasia: 215 mil millones de US$ en Malasia y 1,29 mil millones de US$ en Irán.
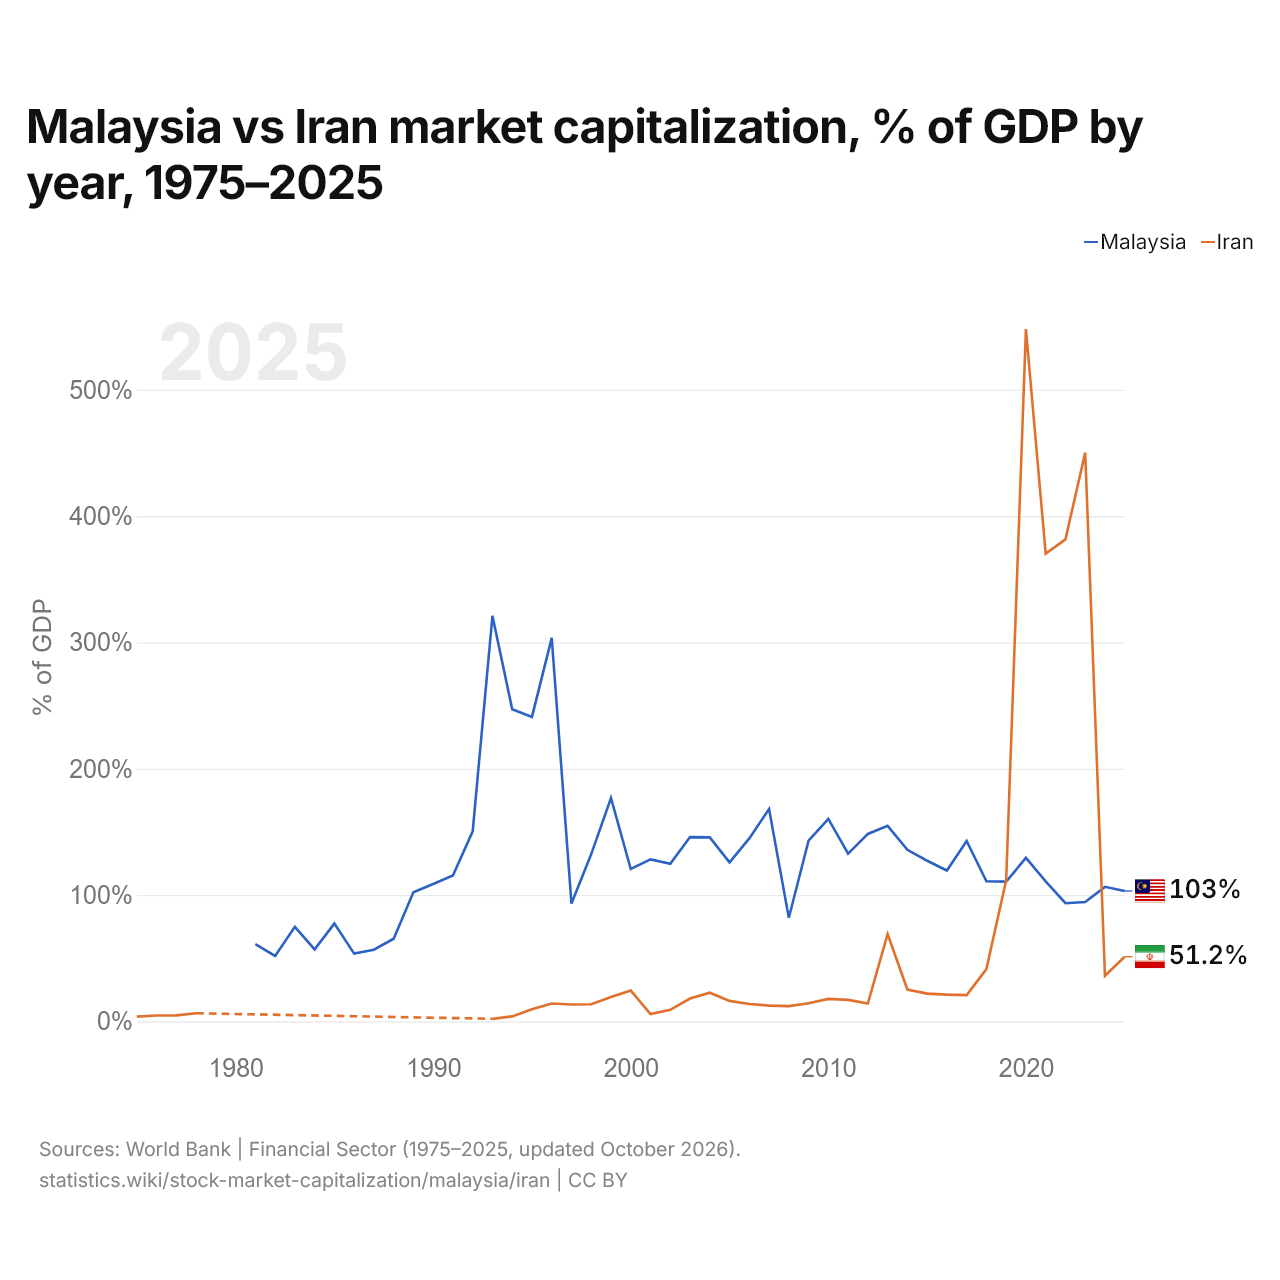
Malasia vs Irán: capitalización bursátil, % del PIB por año, 1975–2025
| Año | % del PIB | |
|---|---|---|
|
Malasia
|
Irán
|
|
| 2025 | 103,2 % | 51,2 % |
| 2024 | 106,5 % | 36,1 % |
| 2023 | 94,5 % | 450,2 % |
| 2022 | 93,5 % | 381,6 % |
| 2021 | 110,8 % | 370,3 % |
| 2020 | 129,4 % | 548 % |
| 2019 | 110,6 % | 111,7 % |
| 2018 | 110,9 % | 41,4 % |
| 2017 | 142,8 % | 20,8 % |
| 2016 | 119,4 % | 21,1 % |
| 2015 | 127,1 % | 21,9 % |
| 2014 | 135,8 % | 25,2 % |
| 2013 | 154,8 % | 69,1 % |
| 2012 | 148,4 % | 14,1 % |
| 2011 | 132,8 % | 17 % |
| 2010 | 160,3 % | 17,8 % |
| 2009 | 143 % | 14,3 % |
| 2008 | 82 % | 12 % |
| 2007 | 168,1 % | 12,5 % |
| 2006 | 144,8 % | 13,7 % |
| 2005 | 125,8 % | 16,2 % |
| 2004 | 145,6 % | 22,7 % |
| 2003 | 145,9 % | 18,1 % |
| 2002 | 124,7 % | 9,1 % |
| 2001 | 128,2 % | 5,8 % |
| 2000 | 120,6 % | 24,4 % |
| 1999 | 176,8 % | 19,2 % |
| 1998 | 132,4 % | 13,5 % |
| 1997 | 93,2 % | 13,3 % |
| 1996 | 303,6 % | 14,1 % |
| 1995 | 241 % | 9,5 % |
| 1994 | 247,1 % | 3,9 % |
| 1993 | 321 % | 2 % |
| 1992 | 150,4 % | - |
| 1991 | 115,4 % | - |
| 1990 | 108,7 % | - |
| 1989 | 102,2 % | - |
| 1988 | 65,4 % | - |
| 1987 | 56,7 % | - |
| 1986 | 53,6 % | - |
| 1985 | 77,4 % | - |
| 1984 | 57 % | - |
| 1983 | 74,8 % | - |
| 1982 | 51,8 % | - |
| 1981 | 61,2 % | - |
| 1980 | - | - |
| 1979 | - | - |
| 1978 | - | 6,4 % |
| 1977 | - | 4,7 % |
| 1976 | - | 4,6 % |
| 1975 | - | 3,7 % |
En 2025, la capitalización bursátil equivalió al 103,2 % del PIB en Malasia y al 51,2 % en Irán: 52,0 puntos porcentuales más en Malasia. En 2015, los porcentajes eran del 127,1 % en Malasia y del 21,9 % en Irán, 105,2 puntos porcentuales más en Malasia.
Malasia vs Irán: última capitalización bursátil y empresas cotizadas
|
Malasia
|
Irán
|
|
|---|---|---|
| Capitalización bursátil | 487 mil M US$ | 186 mil M US$ |
| % del PIB | 103,2 % | 51,2 % |
| Empresas nacionales cotizadas | 1072 | 630 |
| Puesto mundial | 21/77 | 29/77 |
| Diferencia de capitalización bursátil | 2,6× | 0,38× |
Comparar la capitalización bursátil de 2 países cualesquiera
Fuentes:
- Banco Mundial | Sector financiero (1975–2025, actualizado en octubre de 2026)
Creative Commons Atribución (CC BY): puedes copiar, compartir, adaptar y reutilizar este contenido, también con fines comerciales, siempre que cites a statistics.wiki e indiques los cambios que hayas hecho. Las fuentes indicadas arriba pueden tener sus propias condiciones de licencia.