
España vs Rumanía: remesas personales recibidas por año (US$), 1975–2025
| Año | US$ | |
|---|---|---|
 España |
 Rumanía |
|
| 2025 | 7.296.983.565 US$ | 10.647.227.291 US$ |
| 2024 | 6.328.874.671 US$ | 9.526.364.211 US$ |
| 2023 | 5.491.470.306 US$ | 9.965.024.497 US$ |
| 2022 | 4.238.854.695 US$ | 8.781.328.573 US$ |
| 2021 | 3.949.650.833 US$ | 9.115.773.922 US$ |
| 2020 | 3.063.400.973 US$ | 7.625.731.191 US$ |
| 2019 | 3.206.846.642 US$ | 8.142.029.279 US$ |
| 2018 | 3.331.709.084 US$ | 6.983.986.125 US$ |
| 2017 | 3.004.745.214 US$ | 6.555.658.959 US$ |
| 2016 | 2.632.183.875 US$ | 5.929.792.425 US$ |
| 2015 | 2.673.407.399 US$ | 5.391.416.914 US$ |
| 2014 | 3.130.366.133 US$ | 5.083.522.749 US$ |
| 2013 | 3.035.756.690 US$ | 4.805.772.256 US$ |
| 2012 | 2.093.910.956 US$ | 733.218.618 US$ |
| 2011 | 1.714.254.523 US$ | 694.116.383 US$ |
| 2010 | 1.595.954.495 US$ | 641.386.615 US$ |
| 2009 | 1.524.558.689 US$ | 682.463.491 US$ |
| 2008 | 1.840.374.493 US$ | 1.702.335.818 US$ |
| 2007 | 1.676.469.544 US$ | 1.624.282.412 US$ |
| 2006 | 1.281.555.331 US$ | 1.160.464.158 US$ |
| 2005 | 1.135.292.902 US$ | 951.783.338 US$ |
| 2004 | 1.011.285.263 US$ | 131.000.000 US$ |
| 2003 | 900.329.953 US$ | 124.000.000 US$ |
| 2002 | 745.323.091 US$ | 143.000.000 US$ |
| 2001 | 699.655.912 US$ | 116.000.000 US$ |
| 2000 | 648.649.652 US$ | 96.000.000 US$ |
| 1999 | 635.029.160 US$ | 96.000.000 US$ |
| 1998 | 3.253.445.179 US$ | 49.000.000 US$ |
| 1997 | 2.899.429.894 US$ | 16.000.000 US$ |
| 1996 | 2.925.151.760 US$ | 18.000.000 US$ |
| 1995 | 2.763.616.490 US$ | 9.000.000 US$ |
| 1994 | 2.631.302.246 US$ | 11.000.000 US$ |
| 1993 | 2.321.499.512 US$ | - |
| 1992 | 2.636.531.738 US$ | - |
| 1991 | 2.136.283.691 US$ | - |
| 1990 | 2.185.527.832 US$ | - |
| 1989 | 1.861.106.934 US$ | - |
| 1988 | 1.790.329.712 US$ | - |
| 1987 | 1.583.675.903 US$ | - |
| 1986 | 1.433.077.271 US$ | - |
| 1985 | 1.234.490.723 US$ | - |
| 1984 | 1.226.743.164 US$ | - |
| 1983 | 1.348.032.104 US$ | - |
| 1982 | 1.581.557.617 US$ | - |
| 1981 | 1.815.784.424 US$ | - |
| 1980 | 2.187.928.955 US$ | - |
| 1979 | 1.895.898.438 US$ | - |
| 1978 | 1.734.471.313 US$ | - |
| 1977 | 1.463.044.434 US$ | - |
| 1976 | 1.380.182.007 US$ | - |
| 1975 | 1.403.779.907 US$ | - |
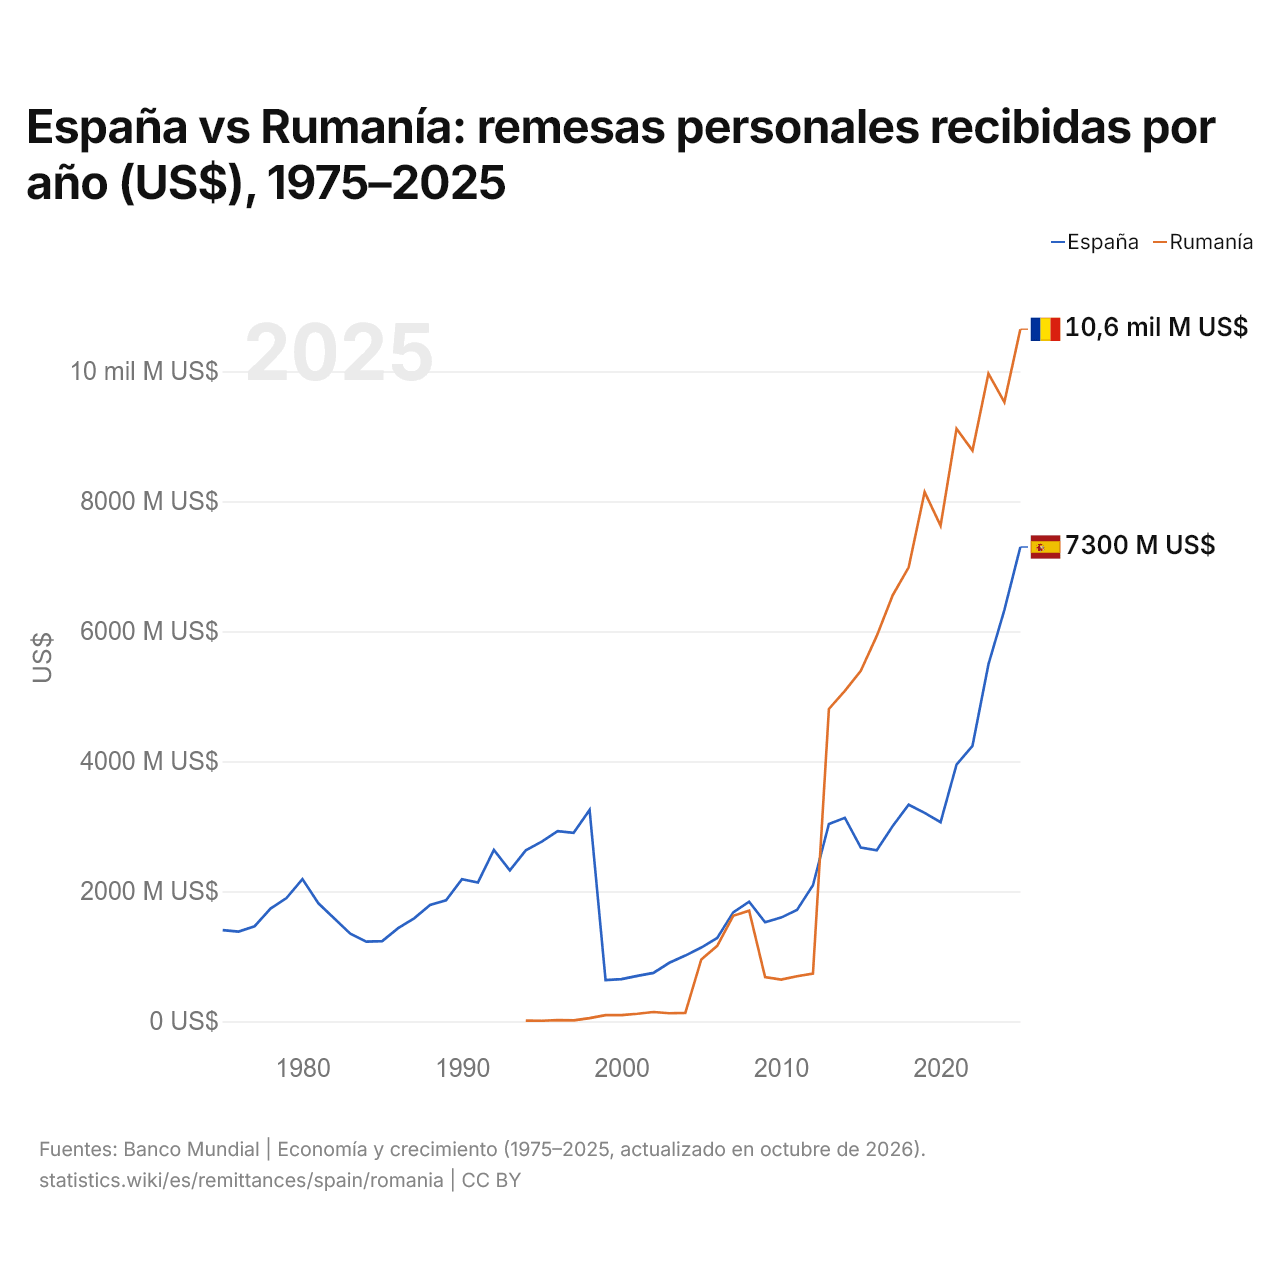
En 2025, las remesas personales recibidas fueron de 7,3 mil millones de US$ en España y de 10,6 mil millones de US$ en Rumanía: un 46 % más en Rumanía. En 1994, las remesas recibidas fueron 240 veces mayores en España: 2,63 mil millones de US$ en España y 11 millones de US$ en Rumanía.
Las remesas personales recibidas en Rumanía han sido mayores que las recibidas en España todos los años desde 2013.
España vs Rumanía: remesas personales recibidas, % del PIB por año, 1975–2025
| Año | % del PIB | |
|---|---|---|
|
España
|
Rumanía
|
|
| 2025 | 0,4 % | 2,5 % |
| 2024 | 0,4 % | 2,5 % |
| 2023 | 0,3 % | 2,9 % |
| 2022 | 0,3 % | 3 % |
| 2021 | 0,3 % | 3,2 % |
| 2020 | 0,2 % | 3 % |
| 2019 | 0,2 % | 3,3 % |
| 2018 | 0,2 % | 2,9 % |
| 2017 | 0,2 % | 3,1 % |
| 2016 | 0,2 % | 3,2 % |
| 2015 | 0,2 % | 3 % |
| 2014 | 0,2 % | 2,5 % |
| 2013 | 0,2 % | 2,5 % |
| 2012 | 0,2 % | 0,4 % |
| 2011 | 0,1 % | 0,4 % |
| 2010 | 0,1 % | 0,4 % |
| 2009 | 0,1 % | 0,4 % |
| 2008 | 0,1 % | 0,8 % |
| 2007 | 0,1 % | 0,9 % |
| 2006 | 0,1 % | 1 % |
| 2005 | 0,1 % | 1 % |
| 2004 | 0,1 % | 0,2 % |
| 2003 | 0,1 % | 0,2 % |
| 2002 | 0,1 % | 0,3 % |
| 2001 | 0,1 % | 0,3 % |
| 2000 | 0,1 % | 0,3 % |
| 1999 | 0,1 % | 0,3 % |
| 1998 | 0,5 % | 0,1 % |
| 1997 | 0,5 % | 0 % |
| 1996 | 0,5 % | 0 % |
| 1995 | 0,4 % | 0 % |
| 1994 | 0,5 % | 0 % |
| 1993 | 0,4 % | - |
| 1992 | 0,4 % | - |
| 1991 | 0,4 % | - |
| 1990 | 0,4 % | - |
| 1989 | 0,4 % | - |
| 1988 | 0,5 % | - |
| 1987 | 0,5 % | - |
| 1986 | 0,6 % | - |
| 1985 | 0,7 % | - |
| 1984 | 0,7 % | - |
| 1983 | 0,8 % | - |
| 1982 | 0,8 % | - |
| 1981 | 0,9 % | - |
| 1980 | 0,9 % | - |
| 1979 | 0,9 % | - |
| 1978 | 1,1 % | - |
| 1977 | 1,1 % | - |
| 1976 | 1,2 % | - |
| 1975 | 1,2 % | - |
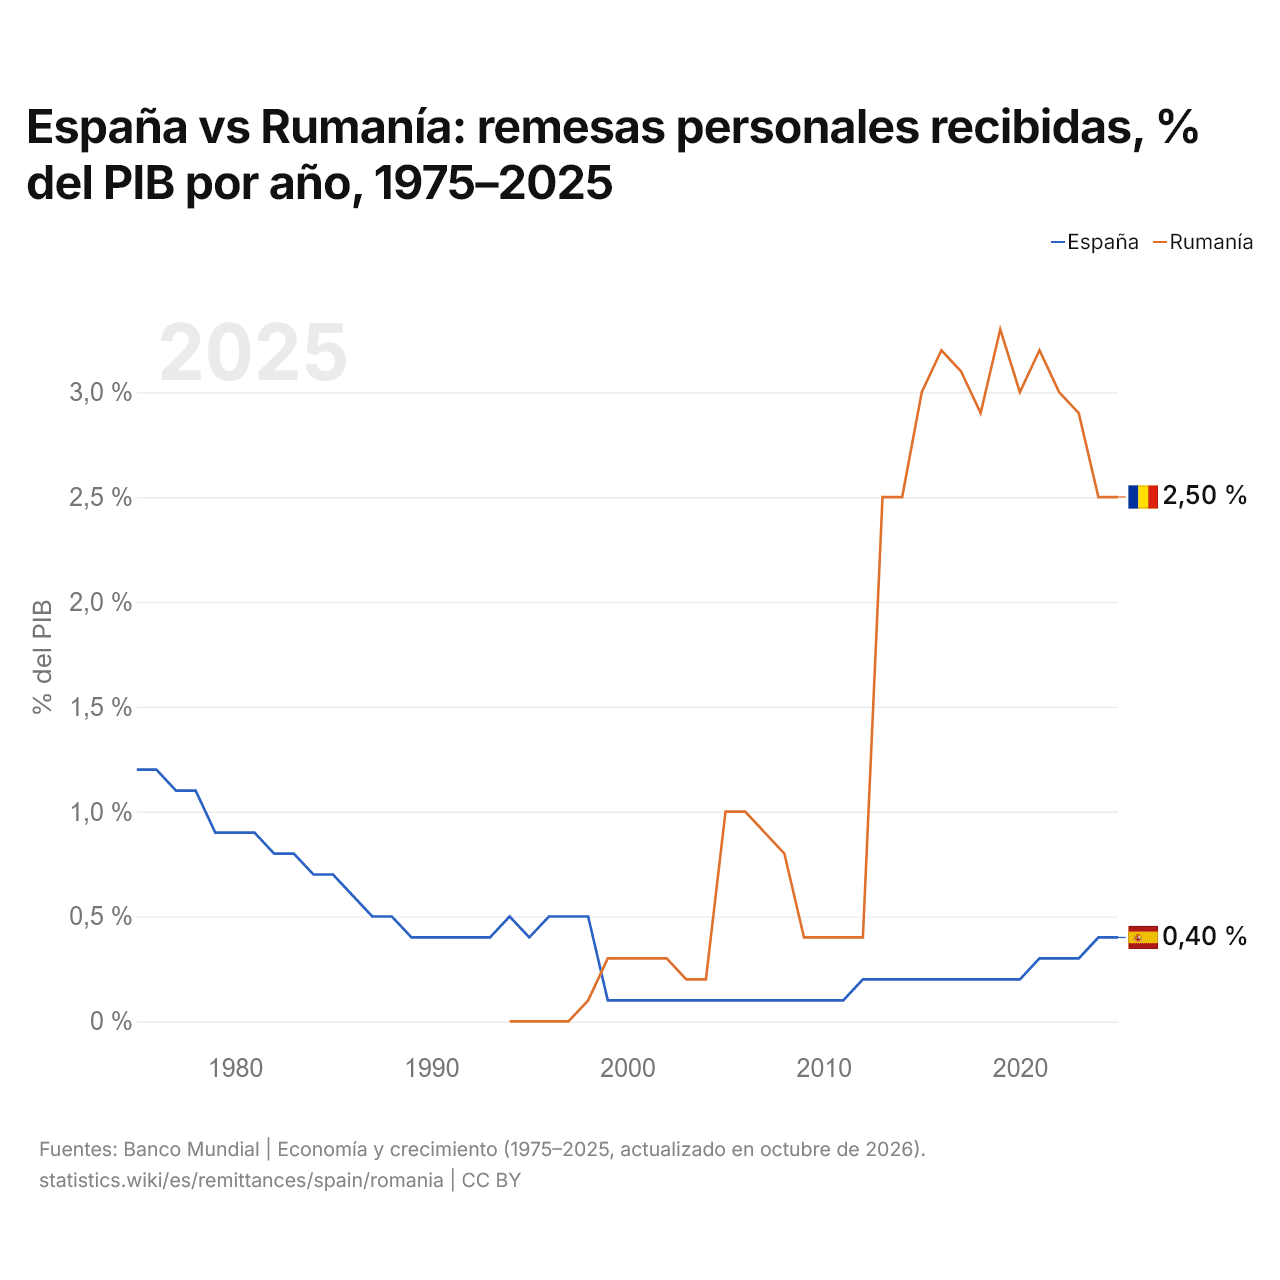
En 2025, las remesas recibidas equivalieron al 0,4 % del PIB en España y al 2,5 % en Rumanía: 2,1 puntos porcentuales más en Rumanía. En 2015, los porcentajes eran del 0,2 % en España y del 3,0 % en Rumanía, 2,8 puntos porcentuales más en Rumanía.
España vs Rumanía: últimas remesas en US$ y % del PIB
|
España
|
Rumanía
|
|
|---|---|---|
| Remesas recibidas | 7300 M US$ | 10,6 mil M US$ |
| % del PIB | 0,4 % | 2,5 % |
| Puesto mundial | 32/181 | 23/181 |
Comparar las remesas recibidas por 2 países cualesquiera
Fuentes:
- Banco Mundial | Economía y crecimiento (1975–2025, actualizado en octubre de 2026)
Creative Commons Atribución (CC BY): puedes copiar, compartir, adaptar y reutilizar este contenido, también con fines comerciales, siempre que cites a statistics.wiki e indiques los cambios que hayas hecho. Las fuentes indicadas arriba pueden tener sus propias condiciones de licencia.