
Senegal vs Gambia: remesas personales recibidas por año (US$), 1974–2025
| Año | US$ | |
|---|---|---|
 Senegal |
 Gambia |
|
| 2025 | - | 616.984.736 US$ |
| 2024 | 3.750.000.000 US$ | 529.052.515 US$ |
| 2023 | 3.267.137.361 US$ | 514.905.280 US$ |
| 2022 | 2.910.590.307 US$ | 501.844.380 US$ |
| 2021 | 3.096.612.365 US$ | 547.051.424 US$ |
| 2020 | 2.607.382.543 US$ | 416.418.881 US$ |
| 2019 | 2.525.650.779 US$ | 275.825.107 US$ |
| 2018 | 2.427.531.906 US$ | 212.034.736 US$ |
| 2017 | 2.148.911.385 US$ | 160.167.345 US$ |
| 2016 | 1.980.581.470 US$ | 145.678.795 US$ |
| 2015 | 1.757.754.462 US$ | 154.062.368 US$ |
| 2014 | 1.931.624.793 US$ | 137.771.209 US$ |
| 2013 | 1.777.897.284 US$ | 109.829.222 US$ |
| 2012 | 1.576.225.069 US$ | 106.349.453 US$ |
| 2011 | 1.616.025.933 US$ | 91.358.954 US$ |
| 2010 | 1.479.119.820 US$ | 115.699.061 US$ |
| 2009 | 1.355.834.397 US$ | 79.801.153 US$ |
| 2008 | 1.482.085.064 US$ | 64.811.559 US$ |
| 2007 | 1.193.376.016 US$ | 55.662.540 US$ |
| 2006 | 926.064.835 US$ | 63.773.517 US$ |
| 2005 | 789.138.740 US$ | 59.304.088 US$ |
| 2004 | 634.031.645 US$ | 60.748.749 US$ |
| 2003 | 512.080.217 US$ | 54.069.839 US$ |
| 2002 | 346.122.851 US$ | - |
| 2001 | 304.944.980 US$ | - |
| 2000 | 234.066.647 US$ | - |
| 1999 | 186.030.797 US$ | - |
| 1998 | 147.418.829 US$ | - |
| 1997 | 150.465.322 US$ | - |
| 1996 | 150.479.199 US$ | - |
| 1995 | 146.028.709 US$ | - |
| 1994 | 113.831.894 US$ | - |
| 1993 | 170.008.347 US$ | - |
| 1992 | 175.676.010 US$ | - |
| 1991 | 162.562.485 US$ | - |
| 1990 | 142.067.581 US$ | - |
| 1989 | 112.755.684 US$ | - |
| 1988 | 117.543.091 US$ | - |
| 1987 | 117.822.601 US$ | - |
| 1986 | 108.949.921 US$ | - |
| 1985 | 79.418.968 US$ | - |
| 1984 | 53.758.190 US$ | - |
| 1983 | 58.966.156 US$ | 701.136 US$ |
| 1982 | 66.310.364 US$ | 187.813 US$ |
| 1981 | 68.192.329 US$ | 289.367 US$ |
| 1980 | 77.054.306 US$ | 390.922 US$ |
| 1979 | 56.270.721 US$ | 492.476 US$ |
| 1978 | 55.615.662 US$ | 345.200 US$ |
| 1977 | 43.064.205 US$ | - |
| 1976 | 45.992.790 US$ | - |
| 1975 | 26.316.662 US$ | - |
| 1974 | 8.516.661 US$ | - |
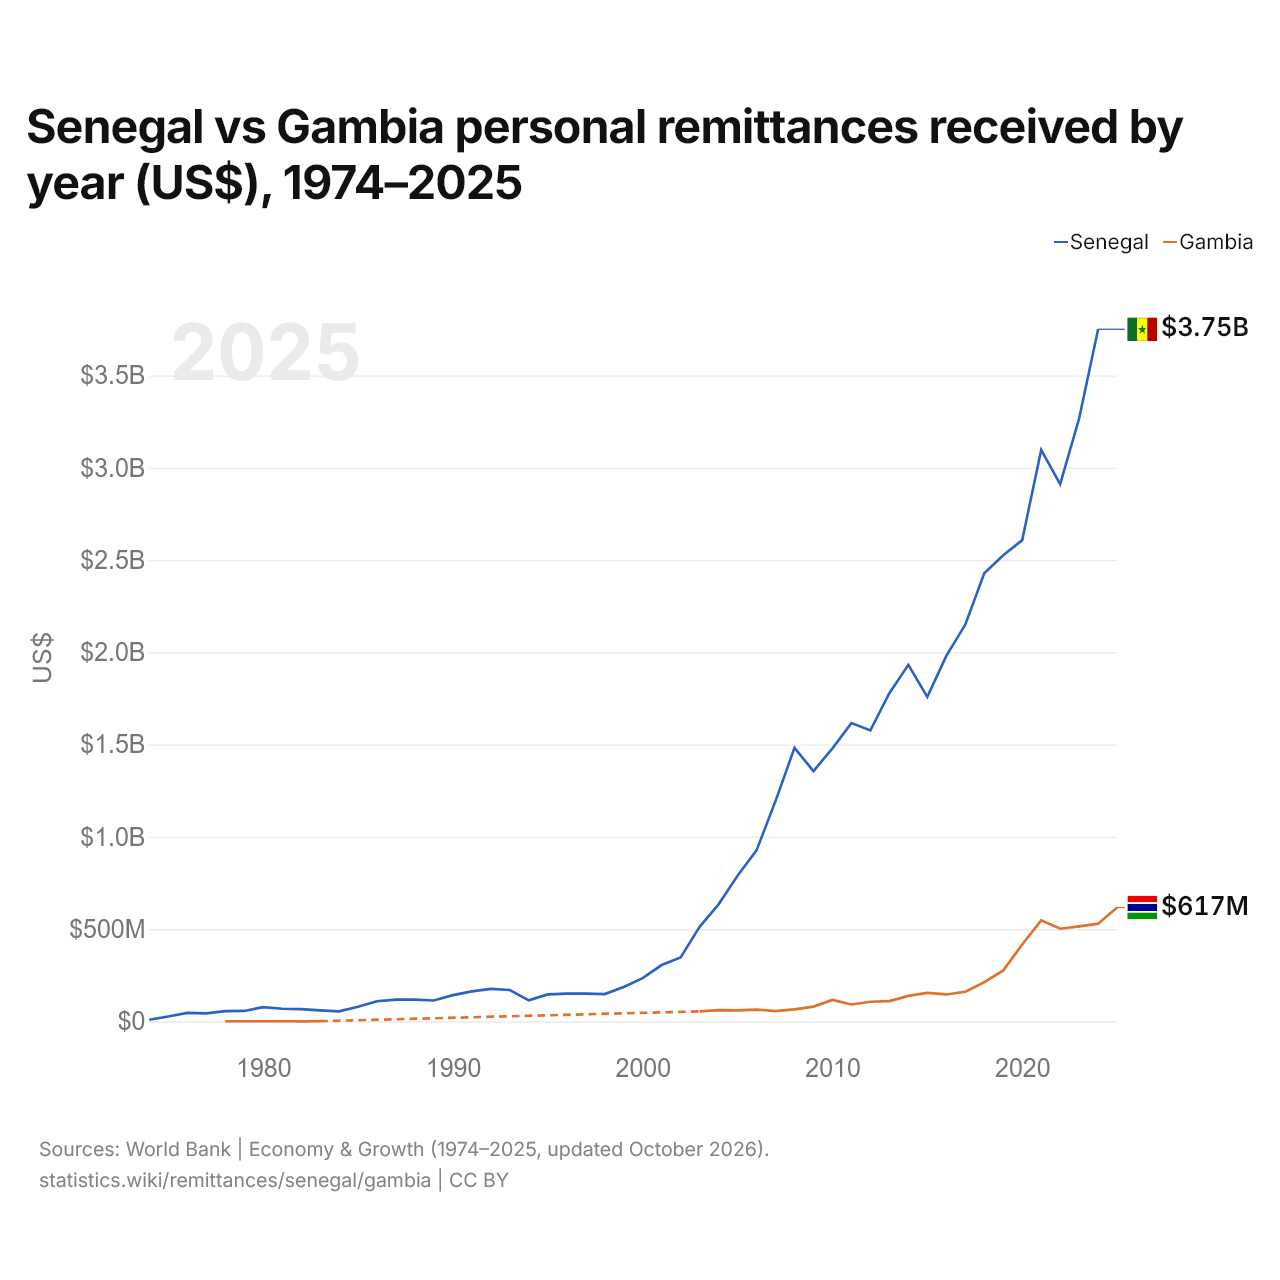
Las remesas personales recibidas fueron de 3,75 mil millones de US$ en Senegal (2024) y de 529 millones de US$ en Gambia (2024): 7,1 veces más en Senegal. En 1978, las remesas recibidas fueron 160 veces mayores en Senegal: 55,6 millones de US$ en Senegal y 345.000 US$ en Gambia.
Senegal vs Gambia: remesas personales recibidas, % del PIB por año, 1974–2025
| Año | % del PIB | |
|---|---|---|
|
Senegal
|
Gambia
|
|
| 2025 | - | 23,8 % |
| 2024 | 11,7 % | 22 % |
| 2023 | 10,6 % | 21,6 % |
| 2022 | 10,5 % | 22,8 % |
| 2021 | 11,3 % | 27,2 % |
| 2020 | 10,6 % | 23 % |
| 2019 | 10,8 % | 15,2 % |
| 2018 | 10,5 % | 12,7 % |
| 2017 | 10,2 % | 10,6 % |
| 2016 | 10,4 % | 9,8 % |
| 2015 | 9,9 % | 11,2 % |
| 2014 | 9,8 % | 11,2 % |
| 2013 | 9,4 % | 8 % |
| 2012 | 8,9 % | 7,5 % |
| 2011 | 9,1 % | 6,5 % |
| 2010 | 9,2 % | 7,5 % |
| 2009 | 8,4 % | 5,5 % |
| 2008 | 8,8 % | 4,1 % |
| 2007 | 8,5 % | 4,3 % |
| 2006 | 7,9 % | 6 % |
| 2005 | 7,2 % | 5,8 % |
| 2004 | 6,3 % | 6,3 % |
| 2003 | 5,8 % | 11,1 % |
| 2002 | 4,9 % | - |
| 2001 | 4,7 % | - |
| 2000 | 3,9 % | - |
| 1999 | 2,8 % | - |
| 1998 | 2,3 % | - |
| 1997 | 2,5 % | - |
| 1996 | 2,3 % | - |
| 1995 | 2,3 % | - |
| 1994 | 2,3 % | - |
| 1993 | 2,3 % | - |
| 1992 | 2,3 % | - |
| 1991 | 2,2 % | - |
| 1990 | 1,9 % | - |
| 1989 | 1,8 % | - |
| 1988 | 1,8 % | - |
| 1987 | 1,8 % | - |
| 1986 | 2 % | - |
| 1985 | 2,1 % | - |
| 1984 | 1,5 % | - |
| 1983 | 1,7 % | 0,3 % |
| 1982 | 1,7 % | 0,1 % |
| 1981 | 1,7 % | 0,1 % |
| 1980 | 1,7 % | 0,2 % |
| 1979 | 1,4 % | 0,2 % |
| 1978 | 1,7 % | 0,2 % |
| 1977 | 1,5 % | - |
| 1976 | 1,6 % | - |
| 1975 | 0,9 % | - |
| 1974 | 0,4 % | - |
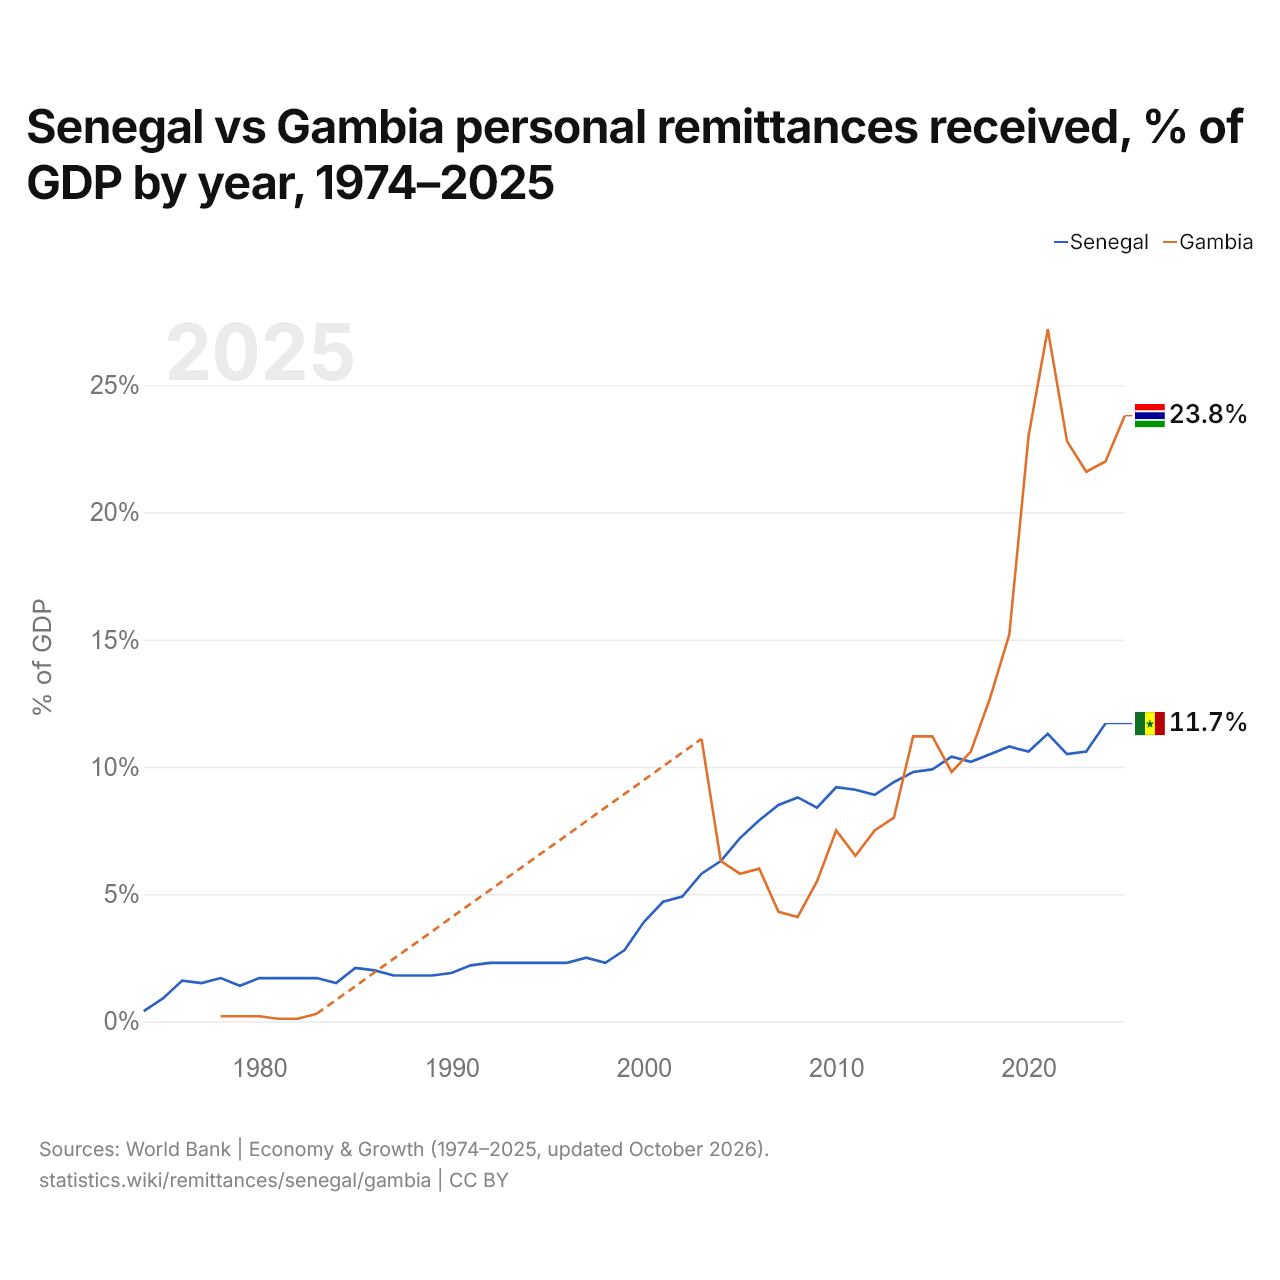
Las remesas recibidas equivalieron al 11,7 % del PIB en Senegal (2024) y al 22,0 % en Gambia (2024): 10,3 puntos porcentuales más en Gambia. En 2014, los porcentajes eran del 9,8 % en Senegal y del 11,2 % en Gambia, 1,4 puntos porcentuales más en Gambia.
Senegal vs Gambia: últimas remesas en US$ y % del PIB
|
Senegal
|
Gambia
|
|
|---|---|---|
| Remesas recibidas | 3750 M US$ (2024) | 617 M US$ (2025) |
| % del PIB | 11,7 % (2024) | 23,8 % (2025) |
| Puesto mundial | 55/181 | 108/181 |
Comparar las remesas recibidas por 2 países cualesquiera
Fuentes:
- Banco Mundial | Economía y crecimiento (1974–2025, actualizado en octubre de 2026)
Creative Commons Atribución (CC BY): puedes copiar, compartir, adaptar y reutilizar este contenido, también con fines comerciales, siempre que cites a statistics.wiki e indiques los cambios que hayas hecho. Las fuentes indicadas arriba pueden tener sus propias condiciones de licencia.