
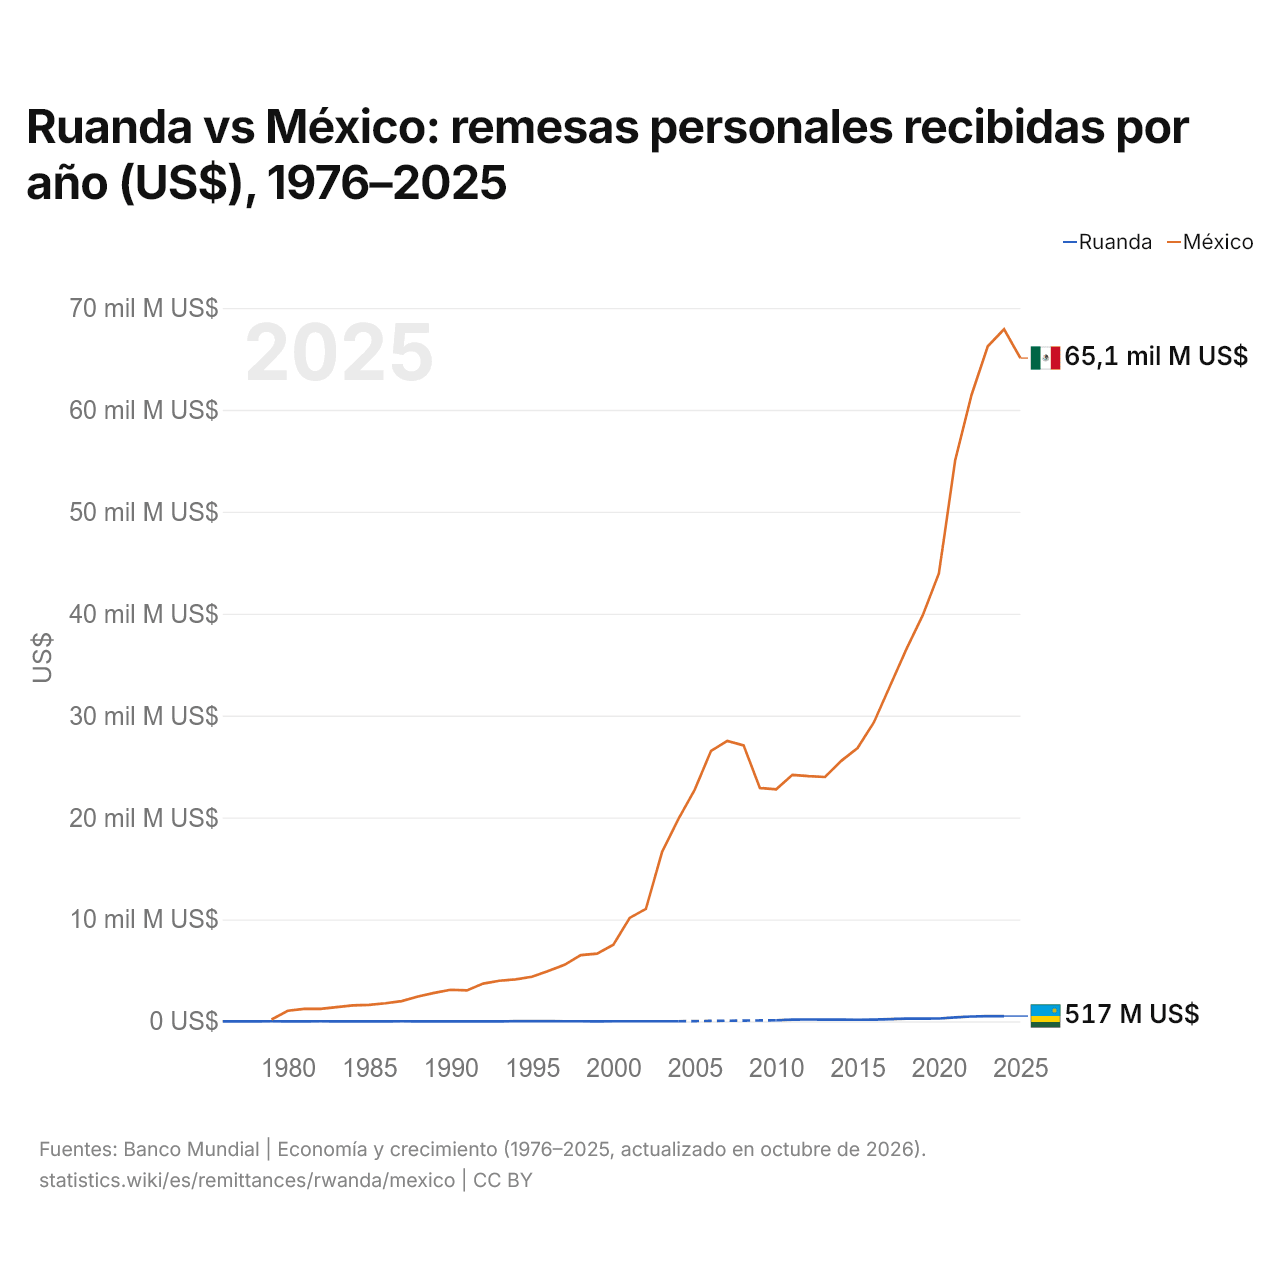
Ruanda vs México: remesas personales recibidas por año (US$), 1976–2025
| Año | US$ | |
|---|---|---|
 Ruanda |
 México |
|
| 2025 | - | 65.086.796.940 US$ |
| 2024 | 517.043.903 US$ | 67.908.368.512 US$ |
| 2023 | 518.060.502 US$ | 66.237.847.600 US$ |
| 2022 | 474.156.654 US$ | 61.457.717.975 US$ |
| 2021 | 391.212.400 US$ | 55.067.029.560 US$ |
| 2020 | 280.069.130 US$ | 43.977.653.965 US$ |
| 2019 | 260.710.295 US$ | 39.833.517.538 US$ |
| 2018 | 260.511.616 US$ | 36.526.305.945 US$ |
| 2017 | 215.292.395 US$ | 32.922.876.924 US$ |
| 2016 | 172.516.841 US$ | 29.328.819.630 US$ |
| 2015 | 159.199.957 US$ | 26.824.907.167 US$ |
| 2014 | 183.593.636 US$ | 25.556.643.773 US$ |
| 2013 | 170.199.423 US$ | 23.976.098.088 US$ |
| 2012 | 182.402.478 US$ | 24.056.599.208 US$ |
| 2011 | 174.202.486 US$ | 24.190.034.859 US$ |
| 2010 | 106.471.877 US$ | 22.767.716.708 US$ |
| 2009 | - | 22.893.127.980 US$ |
| 2008 | - | 27.081.720.166 US$ |
| 2007 | - | 27.516.981.140 US$ |
| 2006 | - | 26.542.811.527 US$ |
| 2005 | - | 22.741.840.918 US$ |
| 2004 | 9.809.776 US$ | 19.861.747.959 US$ |
| 2003 | 9.618.446 US$ | 16.653.686.411 US$ |
| 2002 | 7.210.000 US$ | 11.029.448.100 US$ |
| 2001 | 7.850.031 US$ | 10.146.263.000 US$ |
| 2000 | 6.626.257 US$ | 7.524.742.980 US$ |
| 1999 | 3.317.910 US$ | 6.648.625.182 US$ |
| 1998 | 4.277.427 US$ | 6.501.246.000 US$ |
| 1997 | 5.236.945 US$ | 5.545.800.000 US$ |
| 1996 | 13.181.734 US$ | 4.949.000.000 US$ |
| 1995 | 21.126.524 US$ | 4.368.120.000 US$ |
| 1994 | 12.528.777 US$ | 4.121.819.824 US$ |
| 1993 | 3.931.030 US$ | 3.979.000.000 US$ |
| 1992 | 1.844.129 US$ | 3.700.000.000 US$ |
| 1991 | 3.547.339 US$ | 3.030.000.000 US$ |
| 1990 | 2.628.306 US$ | 3.098.000.000 US$ |
| 1989 | 3.955.135 US$ | 2.793.000.000 US$ |
| 1988 | 3.806.522 US$ | 2.439.000.000 US$ |
| 1987 | 4.480.205 US$ | 1.985.000.000 US$ |
| 1986 | 4.018.682 US$ | 1.771.000.000 US$ |
| 1985 | 2.864.348 US$ | 1.616.000.000 US$ |
| 1984 | 2.943.146 US$ | 1.561.000.000 US$ |
| 1983 | 3.434.140 US$ | 1.391.000.000 US$ |
| 1982 | 7.178.167 US$ | 1.226.000.000 US$ |
| 1981 | 3.900.858 US$ | 1.220.000.000 US$ |
| 1980 | 3.381.209 US$ | 1.039.000.000 US$ |
| 1979 | 4.787.134 US$ | 177.000.000 US$ |
| 1978 | 2.167.891 US$ | - |
| 1977 | 1.177.880 US$ | - |
| 1976 | 247.391 US$ | - |
Las remesas personales recibidas fueron de 517 millones de US$ en Ruanda (2024) y de 67,9 mil millones de US$ en México (2024): 130 veces más en México. En 1979, las remesas recibidas fueron 37 veces mayores en México: 4,79 millones de US$ en Ruanda y 177 millones de US$ en México.
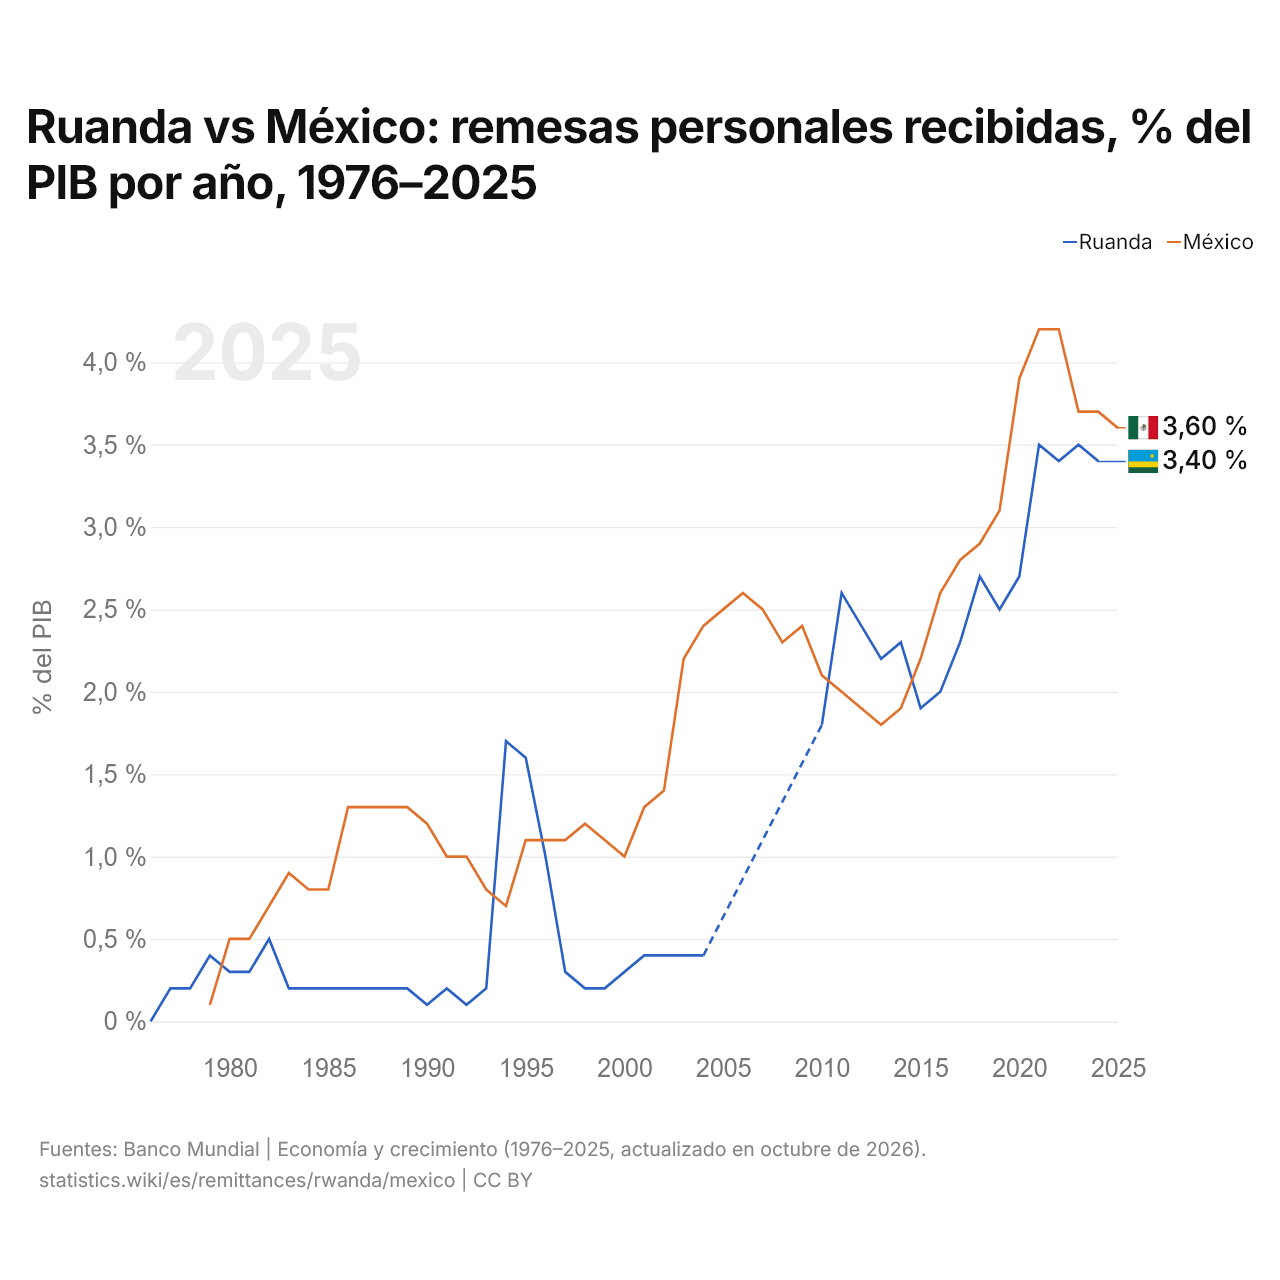
Ruanda vs México: remesas personales recibidas, % del PIB por año, 1976–2025
| Año | % del PIB | |
|---|---|---|
|
Ruanda
|
México
|
|
| 2025 | - | 3,6 % |
| 2024 | 3,4 % | 3,7 % |
| 2023 | 3,5 % | 3,7 % |
| 2022 | 3,4 % | 4,2 % |
| 2021 | 3,5 % | 4,2 % |
| 2020 | 2,7 % | 3,9 % |
| 2019 | 2,5 % | 3,1 % |
| 2018 | 2,7 % | 2,9 % |
| 2017 | 2,3 % | 2,8 % |
| 2016 | 2 % | 2,6 % |
| 2015 | 1,9 % | 2,2 % |
| 2014 | 2,3 % | 1,9 % |
| 2013 | 2,2 % | 1,8 % |
| 2012 | 2,4 % | 1,9 % |
| 2011 | 2,6 % | 2 % |
| 2010 | 1,8 % | 2,1 % |
| 2009 | - | 2,4 % |
| 2008 | - | 2,3 % |
| 2007 | - | 2,5 % |
| 2006 | - | 2,6 % |
| 2005 | - | 2,5 % |
| 2004 | 0,4 % | 2,4 % |
| 2003 | 0,4 % | 2,2 % |
| 2002 | 0,4 % | 1,4 % |
| 2001 | 0,4 % | 1,3 % |
| 2000 | 0,3 % | 1 % |
| 1999 | 0,2 % | 1,1 % |
| 1998 | 0,2 % | 1,2 % |
| 1997 | 0,3 % | 1,1 % |
| 1996 | 1 % | 1,1 % |
| 1995 | 1,6 % | 1,1 % |
| 1994 | 1,7 % | 0,7 % |
| 1993 | 0,2 % | 0,8 % |
| 1992 | 0,1 % | 1 % |
| 1991 | 0,2 % | 1 % |
| 1990 | 0,1 % | 1,2 % |
| 1989 | 0,2 % | 1,3 % |
| 1988 | 0,2 % | 1,3 % |
| 1987 | 0,2 % | 1,3 % |
| 1986 | 0,2 % | 1,3 % |
| 1985 | 0,2 % | 0,8 % |
| 1984 | 0,2 % | 0,8 % |
| 1983 | 0,2 % | 0,9 % |
| 1982 | 0,5 % | 0,7 % |
| 1981 | 0,3 % | 0,5 % |
| 1980 | 0,3 % | 0,5 % |
| 1979 | 0,4 % | 0,1 % |
| 1978 | 0,2 % | - |
| 1977 | 0,2 % | - |
| 1976 | 0 % | - |
Las remesas recibidas equivalieron al 3,4 % del PIB en Ruanda (2024) y al 3,7 % en México (2024): 0,3 puntos porcentuales más en México. En 2014, los porcentajes eran del 2,3 % en Ruanda y del 1,9 % en México, 0,4 puntos porcentuales más en Ruanda.
Ruanda vs México: últimas remesas en US$ y % del PIB
|
Ruanda
|
México
|
|
|---|---|---|
| Remesas recibidas | 517 M US$ (2024) | 65,1 mil M US$ (2025) |
| % del PIB | 3,4 % (2024) | 3,6 % (2025) |
| Puesto mundial | 119/181 | 2/181 |
Comparar las remesas recibidas por 2 países cualesquiera
Fuentes:
- Banco Mundial | Economía y crecimiento (1976–2025, actualizado en octubre de 2026)
Creative Commons Atribución (CC BY): puedes copiar, compartir, adaptar y reutilizar este contenido, también con fines comerciales, siempre que cites a statistics.wiki e indiques los cambios que hayas hecho. Las fuentes indicadas arriba pueden tener sus propias condiciones de licencia.