
Polonia vs Nigeria: remesas personales recibidas por año (US$), 1977–2025
| Año | US$ | |
|---|---|---|
 Polonia |
 Nigeria |
|
| 2025 | 9.461.000.000 US$ | 22.789.097.830 US$ |
| 2024 | 8.690.000.000 US$ | 22.126.757.545 US$ |
| 2023 | 8.540.000.000 US$ | 19.549.549.365 US$ |
| 2022 | 7.564.000.000 US$ | 20.127.614.151 US$ |
| 2021 | 7.929.000.000 US$ | 19.483.402.059 US$ |
| 2020 | 7.438.000.000 US$ | 17.207.547.306 US$ |
| 2019 | 7.515.000.000 US$ | 23.809.281.401 US$ |
| 2018 | 7.603.000.000 US$ | 24.311.022.416 US$ |
| 2017 | 7.305.000.000 US$ | 22.037.016.832 US$ |
| 2016 | 6.763.000.000 US$ | 19.697.938.004 US$ |
| 2015 | 6.835.000.000 US$ | 20.626.046.924 US$ |
| 2014 | 7.468.000.000 US$ | 20.999.084.800 US$ |
| 2013 | 7.457.000.000 US$ | 20.797.073.957 US$ |
| 2012 | 7.041.000.000 US$ | 20.542.884.460 US$ |
| 2011 | 7.768.000.000 US$ | 20.616.772.501 US$ |
| 2010 | 7.712.000.000 US$ | 19.744.755.063 US$ |
| 2009 | 10.214.000.000 US$ | 18.370.796.915 US$ |
| 2008 | 12.321.000.000 US$ | 19.199.974.036 US$ |
| 2007 | 11.975.000.000 US$ | 18.014.430.787 US$ |
| 2006 | 9.563.000.000 US$ | 16.932.144.079 US$ |
| 2005 | 7.283.000.000 US$ | 14.640.084.310 US$ |
| 2004 | 4.724.000.000 US$ | 2.272.734.507 US$ |
| 2003 | 2.284.000.000 US$ | 1.062.820.789 US$ |
| 2002 | 1.685.000.000 US$ | 1.208.958.588 US$ |
| 2001 | 1.563.000.000 US$ | 1.166.614.598 US$ |
| 2000 | 1.496.000.000 US$ | 1.391.826.072 US$ |
| 1999 | 825.000.000 US$ | 1.301.055.577 US$ |
| 1998 | 1.070.000.000 US$ | 448.546.825 US$ |
| 1997 | 848.000.000 US$ | 585.738.410 US$ |
| 1996 | 774.000.000 US$ | 296.587.337 US$ |
| 1995 | 724.000.000 US$ | 250.043.007 US$ |
| 1994 | 581.000.000 US$ | 549.872.704 US$ |
| 1993 | - | 793.154.026 US$ |
| 1992 | - | 56.448.404 US$ |
| 1991 | - | 65.544.714 US$ |
| 1990 | - | 10.008.540 US$ |
| 1989 | - | 10.183.666 US$ |
| 1988 | - | 2.424.527 US$ |
| 1987 | - | 2.739.018 US$ |
| 1986 | - | 3.989.688 US$ |
| 1985 | - | 10.069.659 US$ |
| 1984 | - | 11.741.263 US$ |
| 1983 | - | 13.804.340 US$ |
| 1982 | - | 17.818.397 US$ |
| 1981 | - | 16.188.874 US$ |
| 1980 | - | 21.946.634 US$ |
| 1979 | - | 8.278.045 US$ |
| 1978 | - | 3.148.258 US$ |
| 1977 | - | 20.164.384 US$ |
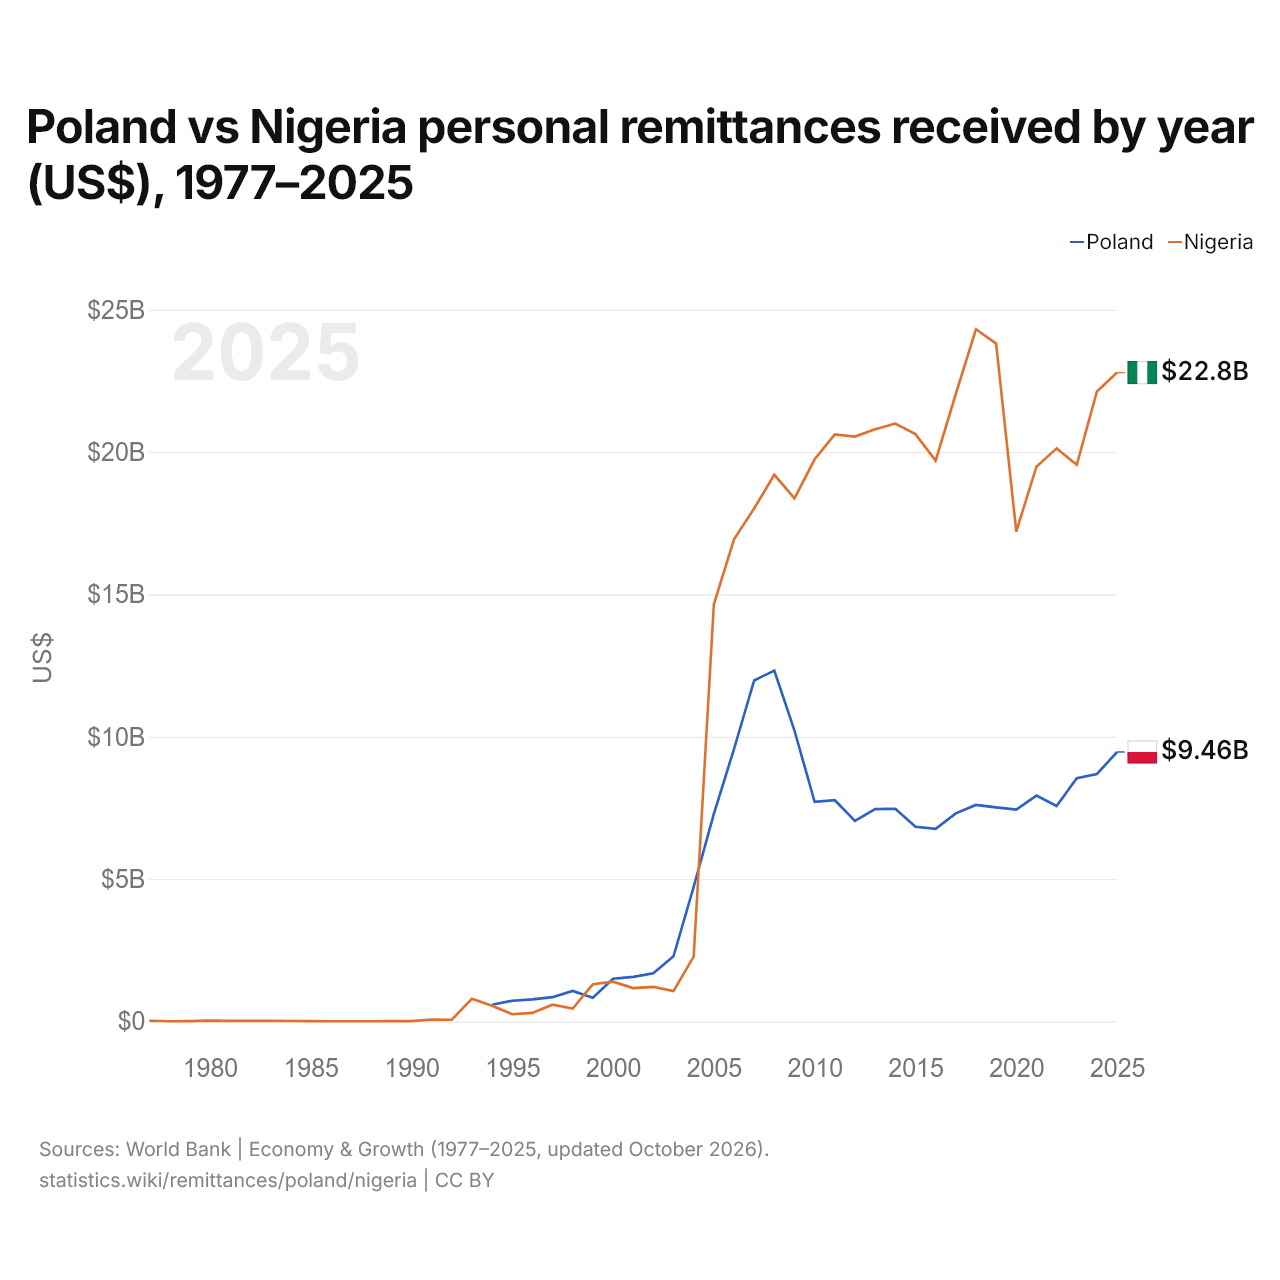
En 2025, las remesas personales recibidas fueron de 9,46 mil millones de US$ en Polonia y de 22,8 mil millones de US$ en Nigeria: 2,4 veces más en Nigeria. En 1994, las remesas recibidas fueron un 5,7 % mayores en Polonia: 581 millones de US$ en Polonia y 550 millones de US$ en Nigeria.
Las remesas personales recibidas en Nigeria han sido mayores que las recibidas en Polonia todos los años desde 2005.
Polonia vs Nigeria: remesas personales recibidas, % del PIB por año, 1977–2025
| Año | % del PIB | |
|---|---|---|
|
Polonia
|
Nigeria
|
|
| 2025 | 0,9 % | 7,8 % |
| 2024 | 0,9 % | 8,8 % |
| 2023 | 1,1 % | 4 % |
| 2022 | 1,1 % | 3,1 % |
| 2021 | 1,2 % | 3,2 % |
| 2020 | 1,2 % | 2,9 % |
| 2019 | 1,2 % | 3,6 % |
| 2018 | 1,3 % | 5,8 % |
| 2017 | 1,4 % | 5,9 % |
| 2016 | 1,4 % | 4,9 % |
| 2015 | 1,4 % | 4,2 % |
| 2014 | 1,4 % | 3,7 % |
| 2013 | 1,4 % | 4 % |
| 2012 | 1,4 % | 4,4 % |
| 2011 | 1,5 % | 5 % |
| 2010 | 1,6 % | 5,4 % |
| 2009 | 2,3 % | 6,2 % |
| 2008 | 2,3 % | 5,7 % |
| 2007 | 2,8 % | 6,5 % |
| 2006 | 2,8 % | 7,1 % |
| 2005 | 2,4 % | 8,3 % |
| 2004 | 1,8 % | 1,7 % |
| 2003 | 1 % | 1 % |
| 2002 | 0,8 % | 1,3 % |
| 2001 | 0,8 % | 1,6 % |
| 2000 | 0,9 % | 2 % |
| 1999 | 0,5 % | 2,2 % |
| 1998 | 0,6 % | 0,2 % |
| 1997 | 0,5 % | 0,3 % |
| 1996 | 0,5 % | 0,2 % |
| 1995 | 0,5 % | 0,2 % |
| 1994 | 0,5 % | 0,7 % |
| 1993 | - | 1,4 % |
| 1992 | - | 0,1 % |
| 1991 | - | 0,1 % |
| 1990 | - | 0 % |
| 1989 | - | 0 % |
| 1988 | - | 0 % |
| 1987 | - | 0 % |
| 1986 | - | 0 % |
| 1985 | - | 0 % |
| 1984 | - | 0 % |
| 1983 | - | 0 % |
| 1982 | - | 0 % |
| 1981 | - | 0 % |
| 1980 | - | 0 % |
| 1979 | - | 0 % |
| 1978 | - | 0 % |
| 1977 | - | 0,1 % |
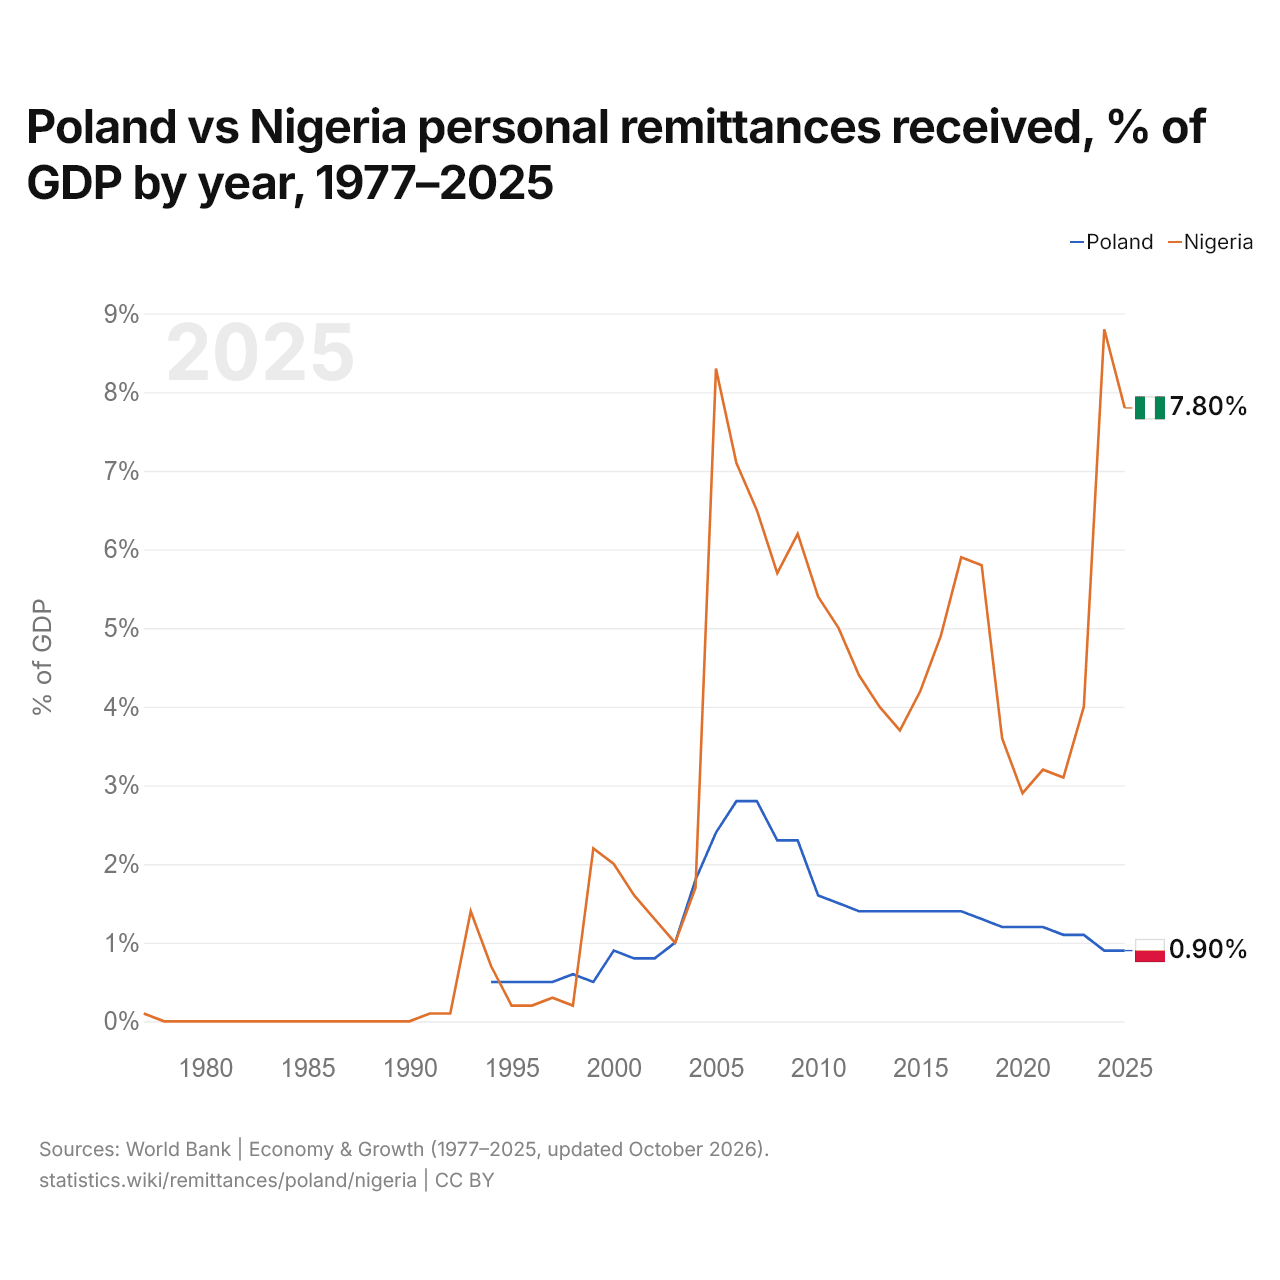
En 2025, las remesas recibidas equivalieron al 0,9 % del PIB en Polonia y al 7,8 % en Nigeria: 6,9 puntos porcentuales más en Nigeria. En 2015, los porcentajes eran del 1,4 % en Polonia y del 4,2 % en Nigeria, 2,8 puntos porcentuales más en Nigeria.
Polonia vs Nigeria: últimas remesas en US$ y % del PIB
|
Polonia
|
Nigeria
|
|
|---|---|---|
| Remesas recibidas | 9460 M US$ | 22,8 mil M US$ |
| % del PIB | 0,9 % | 7,8 % |
| Puesto mundial | 27/181 | 11/181 |
Comparar las remesas recibidas por 2 países cualesquiera
Fuentes:
- Banco Mundial | Economía y crecimiento (1977–2025, actualizado en octubre de 2026)
Creative Commons Atribución (CC BY): puedes copiar, compartir, adaptar y reutilizar este contenido, también con fines comerciales, siempre que cites a statistics.wiki e indiques los cambios que hayas hecho. Las fuentes indicadas arriba pueden tener sus propias condiciones de licencia.