
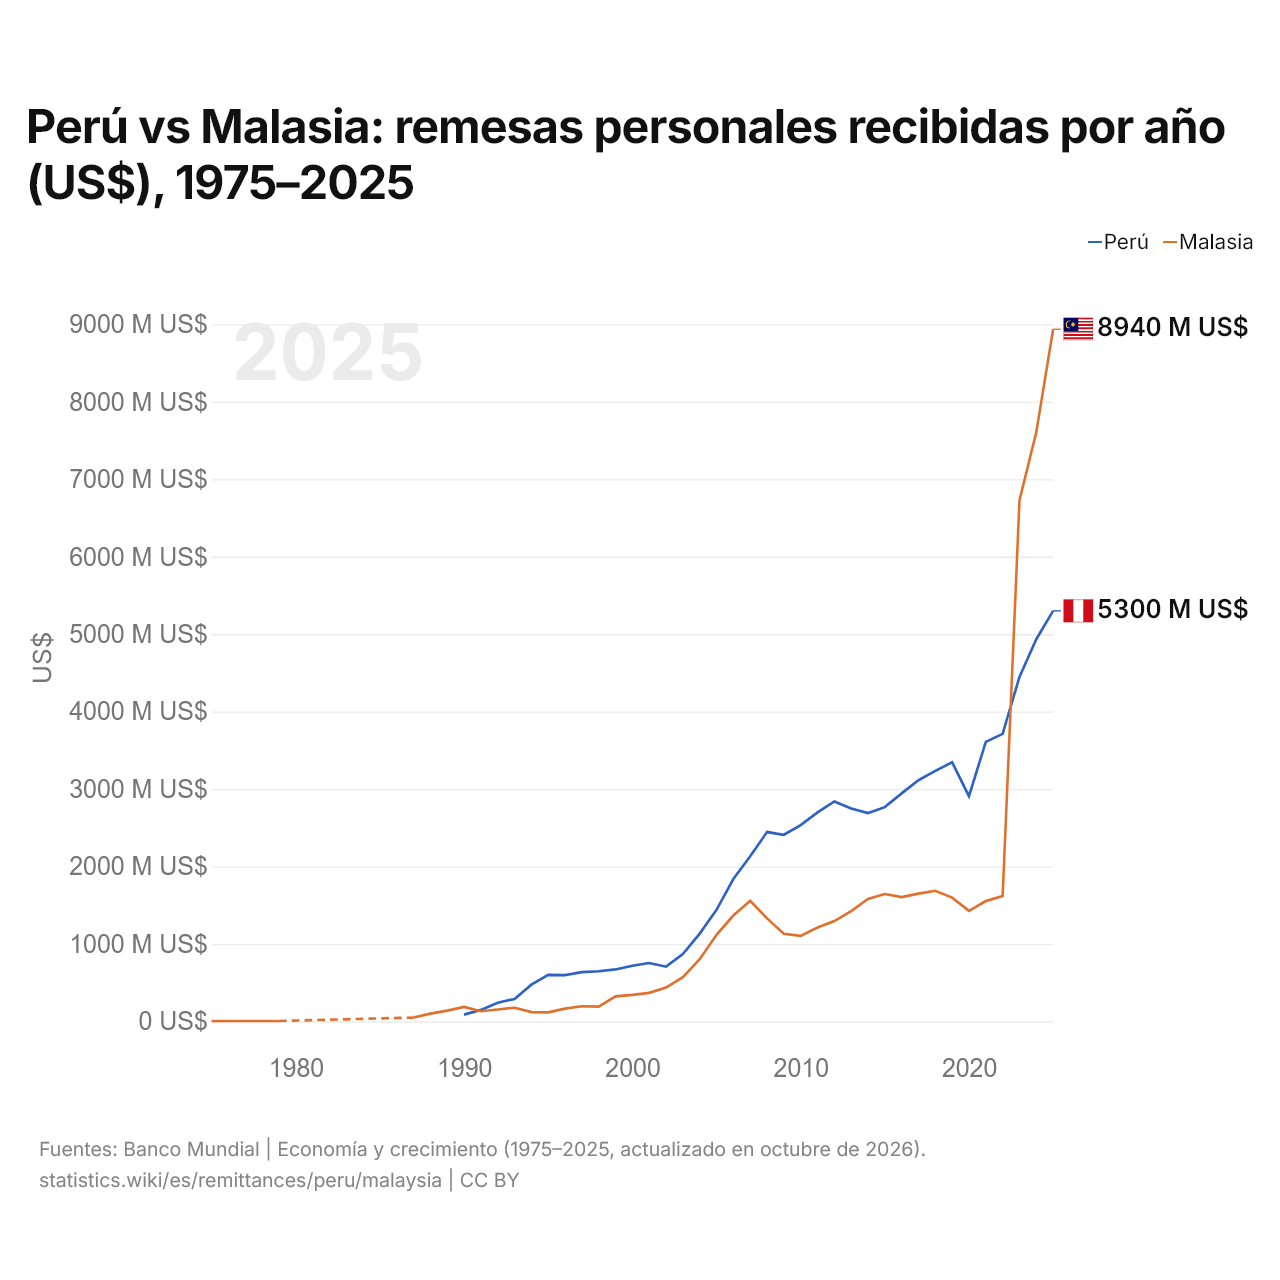
Perú vs Malasia: remesas personales recibidas por año (US$), 1975–2025
| Año | US$ | |
|---|---|---|
 Perú |
 Malasia |
|
| 2025 | 5.299.341.957 US$ | 8.935.072.705 US$ |
| 2024 | 4.933.771.110 US$ | 7.607.171.177 US$ |
| 2023 | 4.446.814.855 US$ | 6.724.869.537 US$ |
| 2022 | 3.710.805.234 US$ | 1.617.714.310 US$ |
| 2021 | 3.607.925.054 US$ | 1.552.334.623 US$ |
| 2020 | 2.906.814.456 US$ | 1.426.684.075 US$ |
| 2019 | 3.344.555.059 US$ | 1.597.353.742 US$ |
| 2018 | 3.234.308.884 US$ | 1.685.578.502 US$ |
| 2017 | 3.112.765.346 US$ | 1.648.944.928 US$ |
| 2016 | 2.943.093.589 US$ | 1.603.918.551 US$ |
| 2015 | 2.765.008.768 US$ | 1.643.720.838 US$ |
| 2014 | 2.689.539.157 US$ | 1.579.517.557 US$ |
| 2013 | 2.748.412.445 US$ | 1.423.370.252 US$ |
| 2012 | 2.839.028.050 US$ | 1.293.805.738 US$ |
| 2011 | 2.696.961.723 US$ | 1.211.496.096 US$ |
| 2010 | 2.533.910.907 US$ | 1.102.925.378 US$ |
| 2009 | 2.408.698.137 US$ | 1.130.872.358 US$ |
| 2008 | 2.443.644.585 US$ | 1.329.070.850 US$ |
| 2007 | 2.130.814.663 US$ | 1.556.236.305 US$ |
| 2006 | 1.837.494.274 US$ | 1.365.476.253 US$ |
| 2005 | 1.440.067.536 US$ | 1.116.972.560 US$ |
| 2004 | 1.132.713.590 US$ | 801.868.421 US$ |
| 2003 | 868.500.000 US$ | 571.052.632 US$ |
| 2002 | 705.382.493 US$ | 435.000.000 US$ |
| 2001 | 753.211.439 US$ | 367.105.263 US$ |
| 2000 | 717.663.840 US$ | 342.368.421 US$ |
| 1999 | 670.000.000 US$ | 322.894.737 US$ |
| 1998 | 647.000.000 US$ | 189.584.329 US$ |
| 1997 | 636.000.000 US$ | 194.441.071 US$ |
| 1996 | 597.000.000 US$ | 164.153.195 US$ |
| 1995 | 599.000.000 US$ | 115.796.006 US$ |
| 1994 | 473.000.000 US$ | 119.271.874 US$ |
| 1993 | 289.000.000 US$ | 175.595.688 US$ |
| 1992 | 240.000.000 US$ | 153.098.282 US$ |
| 1991 | 148.000.000 US$ | 130.178.665 US$ |
| 1990 | 87.000.000 US$ | 185.221.130 US$ |
| 1989 | - | 138.804.718 US$ |
| 1988 | - | 99.664.604 US$ |
| 1987 | - | 48.816.528 US$ |
| 1986 | - | - |
| 1985 | - | - |
| 1984 | - | - |
| 1983 | - | - |
| 1982 | - | - |
| 1981 | - | - |
| 1980 | - | - |
| 1979 | - | 4.569.461 US$ |
| 1978 | - | 4.317.712 US$ |
| 1977 | - | 4.062.921 US$ |
| 1976 | - | 3.934.568 US$ |
| 1975 | - | 4.177.487 US$ |
En 2025, las remesas personales recibidas fueron de 5,3 mil millones de US$ en Perú y de 8,94 mil millones de US$ en Malasia: 1,7 veces más en Malasia. En 1990, las remesas recibidas fueron 2,1 veces mayores en Malasia: 87 millones de US$ en Perú y 185 millones de US$ en Malasia.
Las remesas personales recibidas en Malasia han sido mayores que las recibidas en Perú todos los años desde 2023.
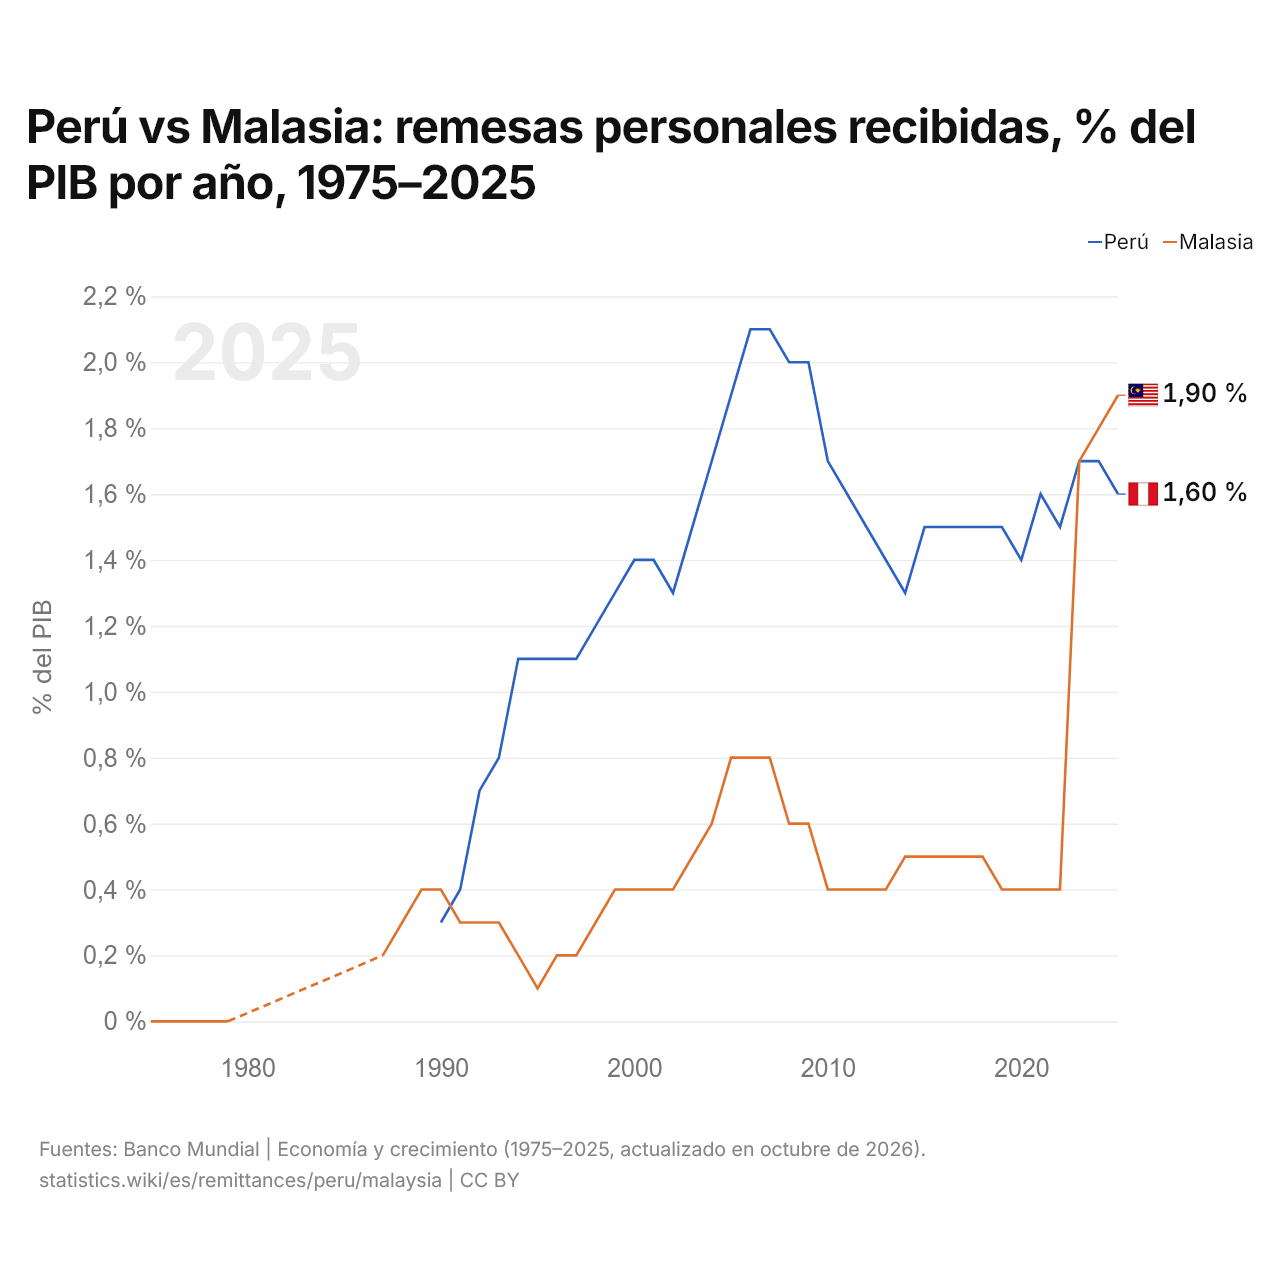
Perú vs Malasia: remesas personales recibidas, % del PIB por año, 1975–2025
| Año | % del PIB | |
|---|---|---|
|
Perú
|
Malasia
|
|
| 2025 | 1,6 % | 1,9 % |
| 2024 | 1,7 % | 1,8 % |
| 2023 | 1,7 % | 1,7 % |
| 2022 | 1,5 % | 0,4 % |
| 2021 | 1,6 % | 0,4 % |
| 2020 | 1,4 % | 0,4 % |
| 2019 | 1,5 % | 0,4 % |
| 2018 | 1,5 % | 0,5 % |
| 2017 | 1,5 % | 0,5 % |
| 2016 | 1,5 % | 0,5 % |
| 2015 | 1,5 % | 0,5 % |
| 2014 | 1,3 % | 0,5 % |
| 2013 | 1,4 % | 0,4 % |
| 2012 | 1,5 % | 0,4 % |
| 2011 | 1,6 % | 0,4 % |
| 2010 | 1,7 % | 0,4 % |
| 2009 | 2 % | 0,6 % |
| 2008 | 2 % | 0,6 % |
| 2007 | 2,1 % | 0,8 % |
| 2006 | 2,1 % | 0,8 % |
| 2005 | 1,9 % | 0,8 % |
| 2004 | 1,7 % | 0,6 % |
| 2003 | 1,5 % | 0,5 % |
| 2002 | 1,3 % | 0,4 % |
| 2001 | 1,4 % | 0,4 % |
| 2000 | 1,4 % | 0,4 % |
| 1999 | 1,3 % | 0,4 % |
| 1998 | 1,2 % | 0,3 % |
| 1997 | 1,1 % | 0,2 % |
| 1996 | 1,1 % | 0,2 % |
| 1995 | 1,1 % | 0,1 % |
| 1994 | 1,1 % | 0,2 % |
| 1993 | 0,8 % | 0,3 % |
| 1992 | 0,7 % | 0,3 % |
| 1991 | 0,4 % | 0,3 % |
| 1990 | 0,3 % | 0,4 % |
| 1989 | - | 0,4 % |
| 1988 | - | 0,3 % |
| 1987 | - | 0,2 % |
| 1986 | - | - |
| 1985 | - | - |
| 1984 | - | - |
| 1983 | - | - |
| 1982 | - | - |
| 1981 | - | - |
| 1980 | - | - |
| 1979 | - | 0 % |
| 1978 | - | 0 % |
| 1977 | - | 0 % |
| 1976 | - | 0 % |
| 1975 | - | 0 % |
En 2025, las remesas recibidas equivalieron al 1,6 % del PIB en Perú y al 1,9 % en Malasia: 0,3 puntos porcentuales más en Malasia. En 2015, los porcentajes eran del 1,5 % en Perú y del 0,5 % en Malasia, 1,0 puntos porcentuales más en Perú.
Perú vs Malasia: últimas remesas en US$ y % del PIB
|
Perú
|
Malasia
|
|
|---|---|---|
| Remesas recibidas | 5300 M US$ | 8940 M US$ |
| % del PIB | 1,6 % | 1,9 % |
| Puesto mundial | 41/181 | 29/181 |
Comparar las remesas recibidas por 2 países cualesquiera
Fuentes:
- Banco Mundial | Economía y crecimiento (1975–2025, actualizado en octubre de 2026)
Creative Commons Atribución (CC BY): puedes copiar, compartir, adaptar y reutilizar este contenido, también con fines comerciales, siempre que cites a statistics.wiki e indiques los cambios que hayas hecho. Las fuentes indicadas arriba pueden tener sus propias condiciones de licencia.