
Israel vs Egipto: remesas personales recibidas por año (US$), 1970–2025
| Año | US$ | |
|---|---|---|
 Israel |
 Egipto |
|
| 2025 | 1.156.800.000 US$ | 41.517.400.000 US$ |
| 2024 | 952.300.000 US$ | 29.559.100.000 US$ |
| 2023 | 990.100.000 US$ | 19.532.100.000 US$ |
| 2022 | 1.265.200.000 US$ | 28.332.800.000 US$ |
| 2021 | 1.230.100.000 US$ | 31.487.000.000 US$ |
| 2020 | 1.032.700.000 US$ | 29.602.900.000 US$ |
| 2019 | 953.400.000 US$ | 26.781.400.000 US$ |
| 2018 | 1.021.600.000 US$ | 25.515.700.000 US$ |
| 2017 | 991.200.000 US$ | 24.737.400.000 US$ |
| 2016 | 963.400.000 US$ | 18.590.400.000 US$ |
| 2015 | 853.100.000 US$ | 18.325.400.000 US$ |
| 2014 | 859.000.000 US$ | 19.570.400.000 US$ |
| 2013 | 764.800.000 US$ | 17.833.100.000 US$ |
| 2012 | 684.900.000 US$ | 19.236.400.000 US$ |
| 2011 | 594.600.000 US$ | 14.324.300.000 US$ |
| 2010 | 571.500.000 US$ | 12.453.100.000 US$ |
| 2009 | 507.000.000 US$ | 7.149.600.000 US$ |
| 2008 | 628.400.000 US$ | 8.694.000.000 US$ |
| 2007 | 579.700.000 US$ | 7.655.800.000 US$ |
| 2006 | 488.800.000 US$ | 5.329.500.000 US$ |
| 2005 | 376.900.000 US$ | 5.017.300.000 US$ |
| 2004 | 297.700.000 US$ | 3.340.700.000 US$ |
| 2003 | 171.200.000 US$ | 2.960.900.000 US$ |
| 2002 | 166.600.000 US$ | 2.893.100.000 US$ |
| 2001 | 195.600.000 US$ | 2.911.400.000 US$ |
| 2000 | 182.400.000 US$ | 2.852.000.000 US$ |
| 1999 | 174.200.000 US$ | 3.235.300.000 US$ |
| 1998 | 134.500.000 US$ | 3.370.000.000 US$ |
| 1997 | 200.200.000 US$ | 3.697.000.000 US$ |
| 1996 | 157.600.000 US$ | 3.107.000.000 US$ |
| 1995 | 177.900.000 US$ | 3.226.000.000 US$ |
| 1994 | 1.602.300.049 US$ | 3.672.000.000 US$ |
| 1993 | 1.263.300.049 US$ | 5.664.000.000 US$ |
| 1992 | 1.160.199.951 US$ | 6.104.000.000 US$ |
| 1991 | 876.799.988 US$ | 4.054.000.000 US$ |
| 1990 | 811.900.024 US$ | 4.283.500.000 US$ |
| 1989 | 783.700.012 US$ | 3.293.454.590 US$ |
| 1988 | 542.000.000 US$ | 3.769.571.533 US$ |
| 1987 | 613.599.976 US$ | 3.604.285.645 US$ |
| 1986 | 448.700.012 US$ | 2.506.142.822 US$ |
| 1985 | 209.399.994 US$ | 3.211.714.355 US$ |
| 1984 | 253.000.000 US$ | 3.962.714.355 US$ |
| 1983 | 242.600.006 US$ | 3.665.857.178 US$ |
| 1982 | 280.299.988 US$ | 2.439.142.822 US$ |
| 1981 | 531.799.988 US$ | 2.180.857.178 US$ |
| 1980 | 421.000.000 US$ | 2.696.000.000 US$ |
| 1979 | 335.000.000 US$ | 2.213.571.533 US$ |
| 1978 | 194.000.000 US$ | 1.773.296.997 US$ |
| 1977 | 106.000.000 US$ | 927.665.100 US$ |
| 1976 | 72.000.000 US$ | - |
| 1975 | 101.000.000 US$ | - |
| 1974 | 130.000.000 US$ | - |
| 1973 | 178.000.000 US$ | - |
| 1972 | 190.000.000 US$ | - |
| 1971 | 140.000.000 US$ | - |
| 1970 | 72.000.000 US$ | - |
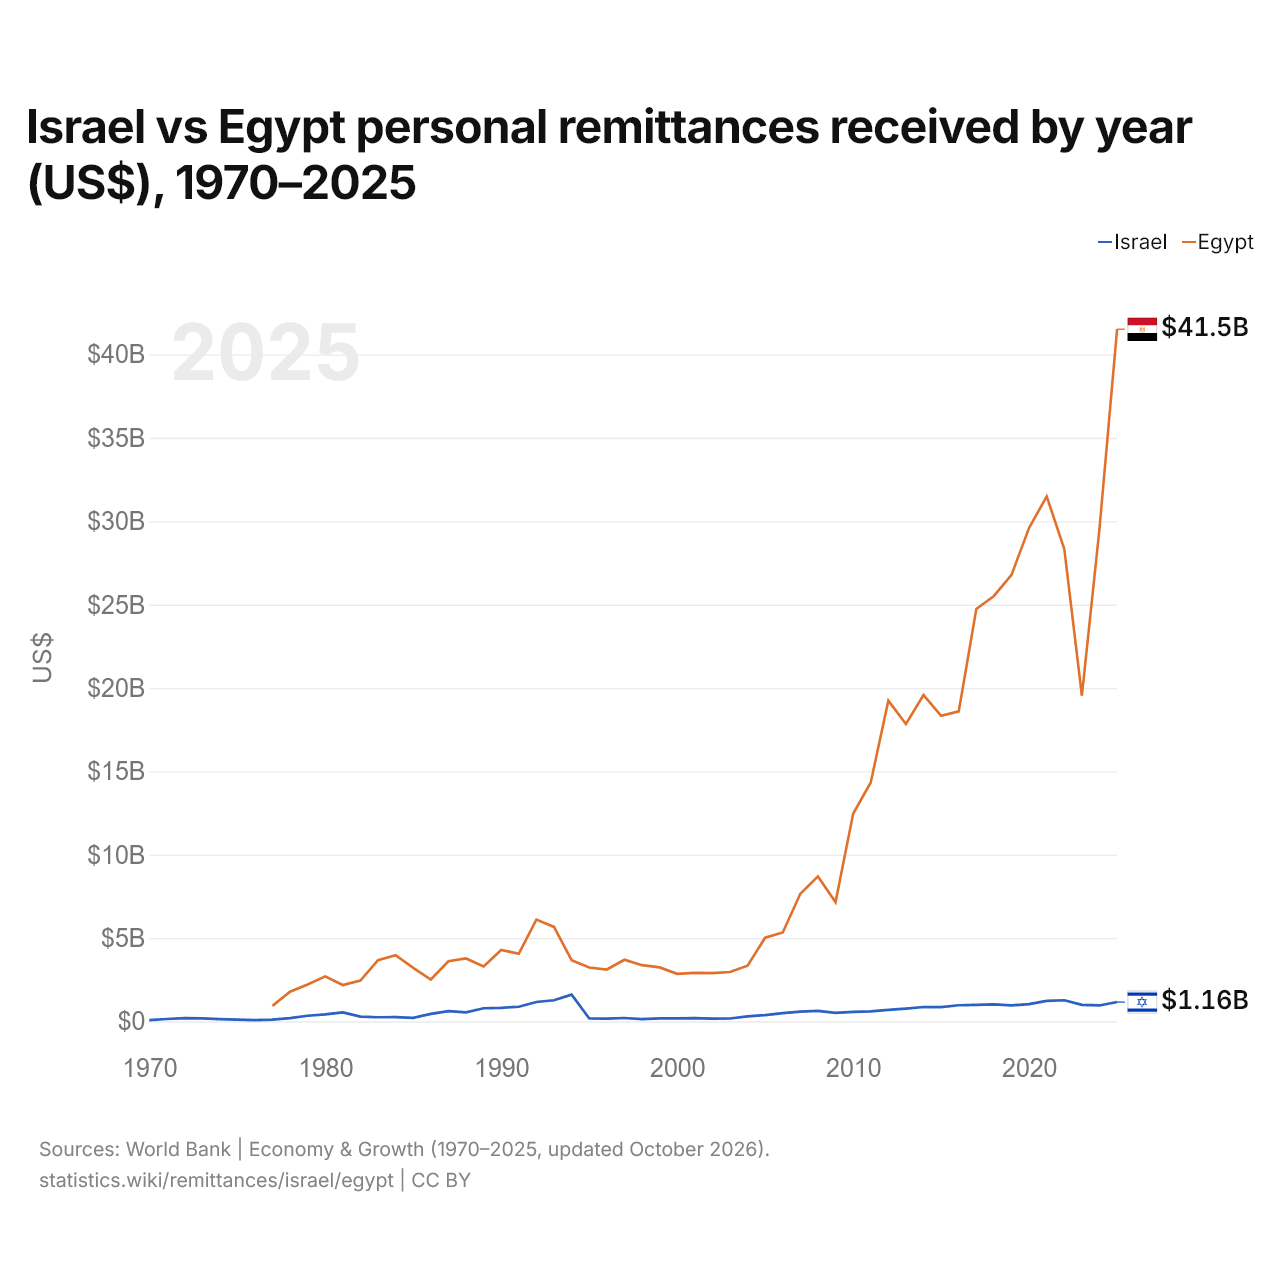
En 2025, las remesas personales recibidas fueron de 1,16 mil millones de US$ en Israel y de 41,5 mil millones de US$ en Egipto: 36 veces más en Egipto. En 1977, las remesas recibidas fueron 8,8 veces mayores en Egipto: 106 millones de US$ en Israel y 928 millones de US$ en Egipto.
Las remesas personales recibidas en Egipto han sido mayores que las recibidas en Israel todos los años desde 1977.
Israel vs Egipto: remesas personales recibidas, % del PIB por año, 1970–2025
| Año | % del PIB | |
|---|---|---|
|
Israel
|
Egipto
|
|
| 2025 | 0,2 % | 11,4 % |
| 2024 | 0,2 % | 7,6 % |
| 2023 | 0,2 % | 4,9 % |
| 2022 | 0,2 % | 5,9 % |
| 2021 | 0,3 % | 7,4 % |
| 2020 | 0,3 % | 7,7 % |
| 2019 | 0,2 % | 8,4 % |
| 2018 | 0,3 % | 9,7 % |
| 2017 | 0,3 % | 10 % |
| 2016 | 0,3 % | 5,6 % |
| 2015 | 0,3 % | 5,6 % |
| 2014 | 0,3 % | 6,4 % |
| 2013 | 0,3 % | 6,2 % |
| 2012 | 0,3 % | 6,9 % |
| 2011 | 0,2 % | 6,1 % |
| 2010 | 0,2 % | 5,7 % |
| 2009 | 0,2 % | 3,8 % |
| 2008 | 0,3 % | 5,3 % |
| 2007 | 0,3 % | 5,9 % |
| 2006 | 0,3 % | 5 % |
| 2005 | 0,3 % | 5,6 % |
| 2004 | 0,2 % | 4,2 % |
| 2003 | 0,1 % | 3,7 % |
| 2002 | 0,1 % | 3,4 % |
| 2001 | 0,1 % | 3 % |
| 2000 | 0,1 % | 2,9 % |
| 1999 | 0,1 % | 3,6 % |
| 1998 | 0,1 % | 4 % |
| 1997 | 0,2 % | 4,7 % |
| 1996 | 0,1 % | 4,6 % |
| 1995 | 0,2 % | 5,4 % |
| 1994 | 1,8 % | 7,1 % |
| 1993 | 1,6 % | 12,2 % |
| 1992 | 1,5 % | 14,6 % |
| 1991 | 1,2 % | 10,8 % |
| 1990 | 1,3 % | 10 % |
| 1989 | 1,5 % | 8,3 % |
| 1988 | 1 % | 10,8 % |
| 1987 | 1,4 % | 8,9 % |
| 1986 | 1,3 % | 6,1 % |
| 1985 | 0,7 % | 8,2 % |
| 1984 | 0,8 % | 11,7 % |
| 1983 | 0,7 % | 11,8 % |
| 1982 | 1 % | 8,8 % |
| 1981 | 2 % | 9,9 % |
| 1980 | 1,7 % | 12,4 % |
| 1979 | 1,5 % | 12,3 % |
| 1978 | 1,1 % | 12 % |
| 1977 | 0,6 % | 6,4 % |
| 1976 | 0,5 % | - |
| 1975 | 0,6 % | - |
| 1974 | 0,8 % | - |
| 1973 | 1,5 % | - |
| 1972 | 2,1 % | - |
| 1971 | 2 % | - |
| 1970 | 1 % | - |
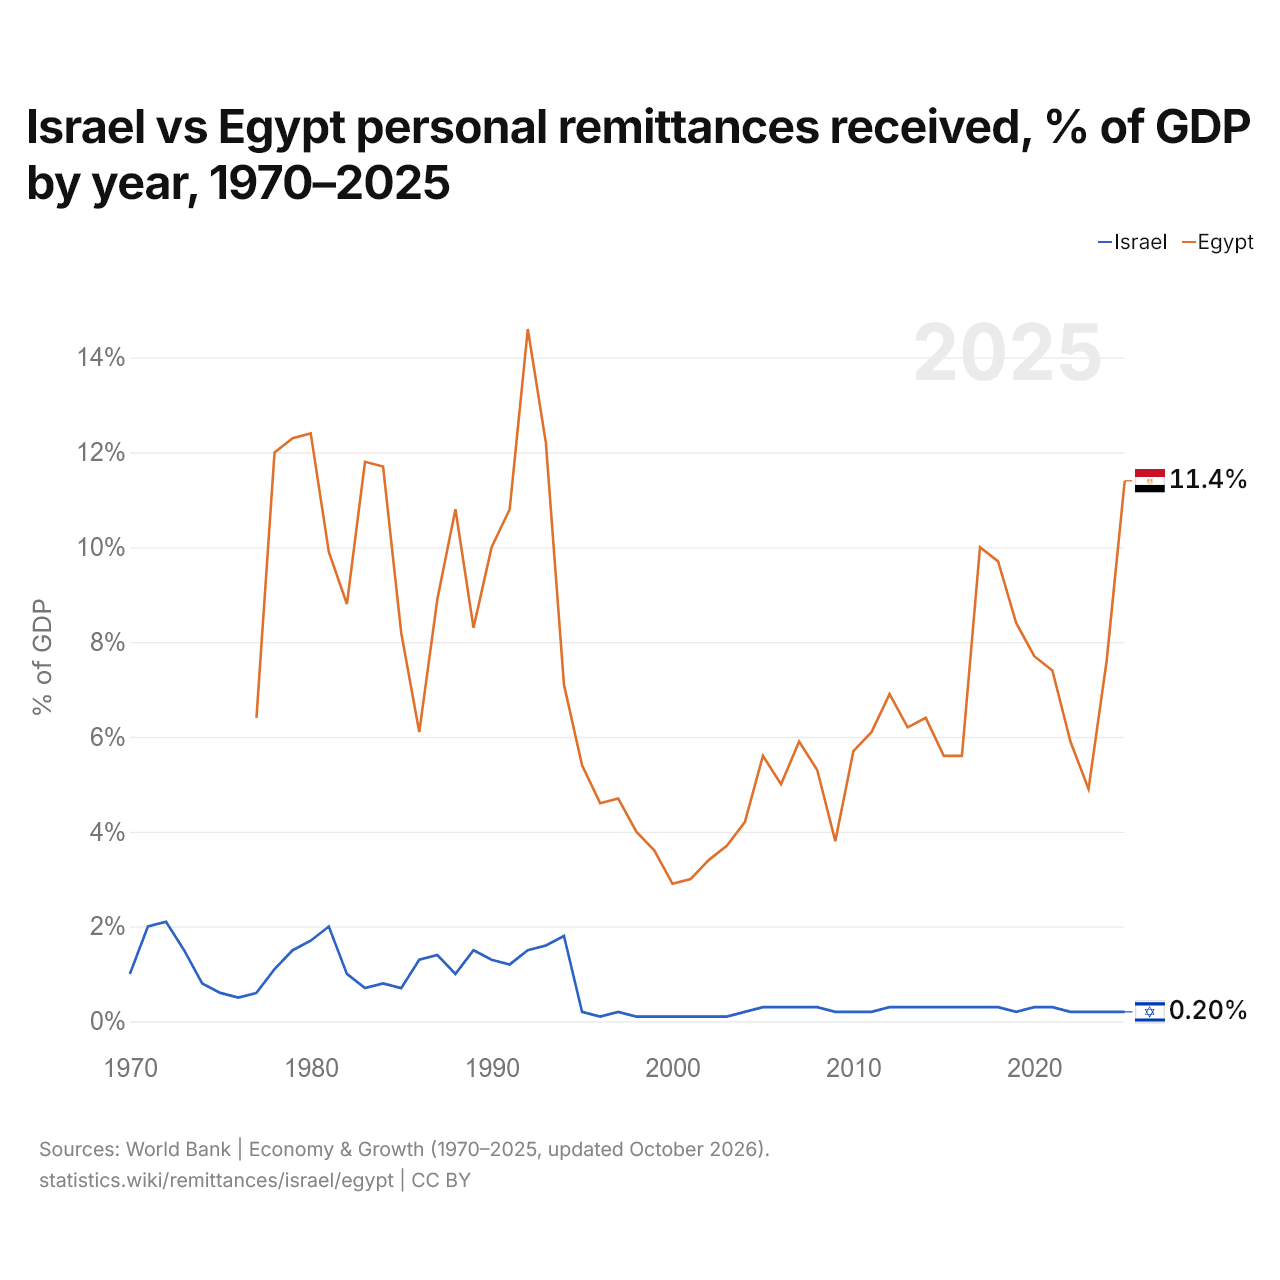
En 2025, las remesas recibidas equivalieron al 0,2 % del PIB en Israel y al 11,4 % en Egipto: 11,2 puntos porcentuales más en Egipto. En 2015, los porcentajes eran del 0,3 % en Israel y del 5,6 % en Egipto, 5,3 puntos porcentuales más en Egipto.
Israel vs Egipto: últimas remesas en US$ y % del PIB
|
Israel
|
Egipto
|
|
|---|---|---|
| Remesas recibidas | 1160 M US$ | 41,5 mil M US$ |
| % del PIB | 0,2 % | 11,4 % |
| Puesto mundial | 86/181 | 5/181 |
Comparar las remesas recibidas por 2 países cualesquiera
Fuentes:
- Banco Mundial | Economía y crecimiento (1970–2025, actualizado en octubre de 2026)
Creative Commons Atribución (CC BY): puedes copiar, compartir, adaptar y reutilizar este contenido, también con fines comerciales, siempre que cites a statistics.wiki e indiques los cambios que hayas hecho. Las fuentes indicadas arriba pueden tener sus propias condiciones de licencia.