
Finlandia vs Dinamarca: remesas personales recibidas por año (US$), 1975–2025
| Año | US$ | |
|---|---|---|
 Finlandia |
 Dinamarca |
|
| 2025 | 876.423.721 US$ | 1.688.861.196 US$ |
| 2024 | 839.823.617 US$ | 1.614.178.908 US$ |
| 2023 | 748.264.240 US$ | 1.520.447.682 US$ |
| 2022 | 661.569.130 US$ | 1.399.676.713 US$ |
| 2021 | 667.355.299 US$ | 1.412.877.342 US$ |
| 2020 | 598.130.661 US$ | 1.332.176.511 US$ |
| 2019 | 841.961.779 US$ | 1.449.639.210 US$ |
| 2018 | 841.053.346 US$ | 1.415.297.049 US$ |
| 2017 | 908.303.116 US$ | 1.314.451.448 US$ |
| 2016 | 860.964.517 US$ | 1.247.014.793 US$ |
| 2015 | 865.419.881 US$ | 1.258.255.663 US$ |
| 2014 | 1.068.529.689 US$ | 1.483.021.800 US$ |
| 2013 | 1.073.207.239 US$ | 1.370.760.789 US$ |
| 2012 | 1.682.470.994 US$ | 1.182.244.240 US$ |
| 2011 | 1.694.181.088 US$ | 1.149.885.933 US$ |
| 2010 | 1.006.293.135 US$ | 925.467.462 US$ |
| 2009 | 1.108.922.178 US$ | 1.019.066.492 US$ |
| 2008 | 1.127.301.050 US$ | 1.051.704.665 US$ |
| 2007 | 991.328.671 US$ | 823.203.959 US$ |
| 2006 | 885.424.667 US$ | 740.266.389 US$ |
| 2005 | 692.277.076 US$ | 666.091.577 US$ |
| 2004 | 666.913.867 US$ | 1.075.395.076 US$ |
| 2003 | 526.381.939 US$ | 940.572.302 US$ |
| 2002 | 477.152.547 US$ | 784.859.297 US$ |
| 2001 | 490.718.040 US$ | 698.623.282 US$ |
| 2000 | 472.728.415 US$ | 666.510.056 US$ |
| 1999 | 443.613.009 US$ | 803.208.184 US$ |
| 1998 | 375.411.976 US$ | 765.494.251 US$ |
| 1997 | 235.253.974 US$ | 852.389.081 US$ |
| 1996 | 145.460.571 US$ | 687.658.142 US$ |
| 1995 | 74.258.863 US$ | 522.927.177 US$ |
| 1994 | 66.893.753 US$ | 438.739.166 US$ |
| 1993 | 77.051.125 US$ | 449.906.006 US$ |
| 1992 | 103.113.152 US$ | 464.252.472 US$ |
| 1991 | 101.185.310 US$ | - |
| 1990 | 62.883.602 US$ | - |
| 1989 | 70.851.074 US$ | - |
| 1988 | 105.305.138 US$ | - |
| 1987 | 77.741.463 US$ | - |
| 1986 | 74.044.212 US$ | - |
| 1985 | 50.871.544 US$ | - |
| 1984 | 49.415.207 US$ | - |
| 1983 | 97.178.131 US$ | - |
| 1982 | 107.548.988 US$ | - |
| 1981 | 95.759.995 US$ | - |
| 1980 | 106.253.777 US$ | - |
| 1979 | 91.440.735 US$ | - |
| 1978 | 65.478.401 US$ | - |
| 1977 | 46.703.991 US$ | - |
| 1976 | 23.807.751 US$ | - |
| 1975 | 18.514.946 US$ | - |
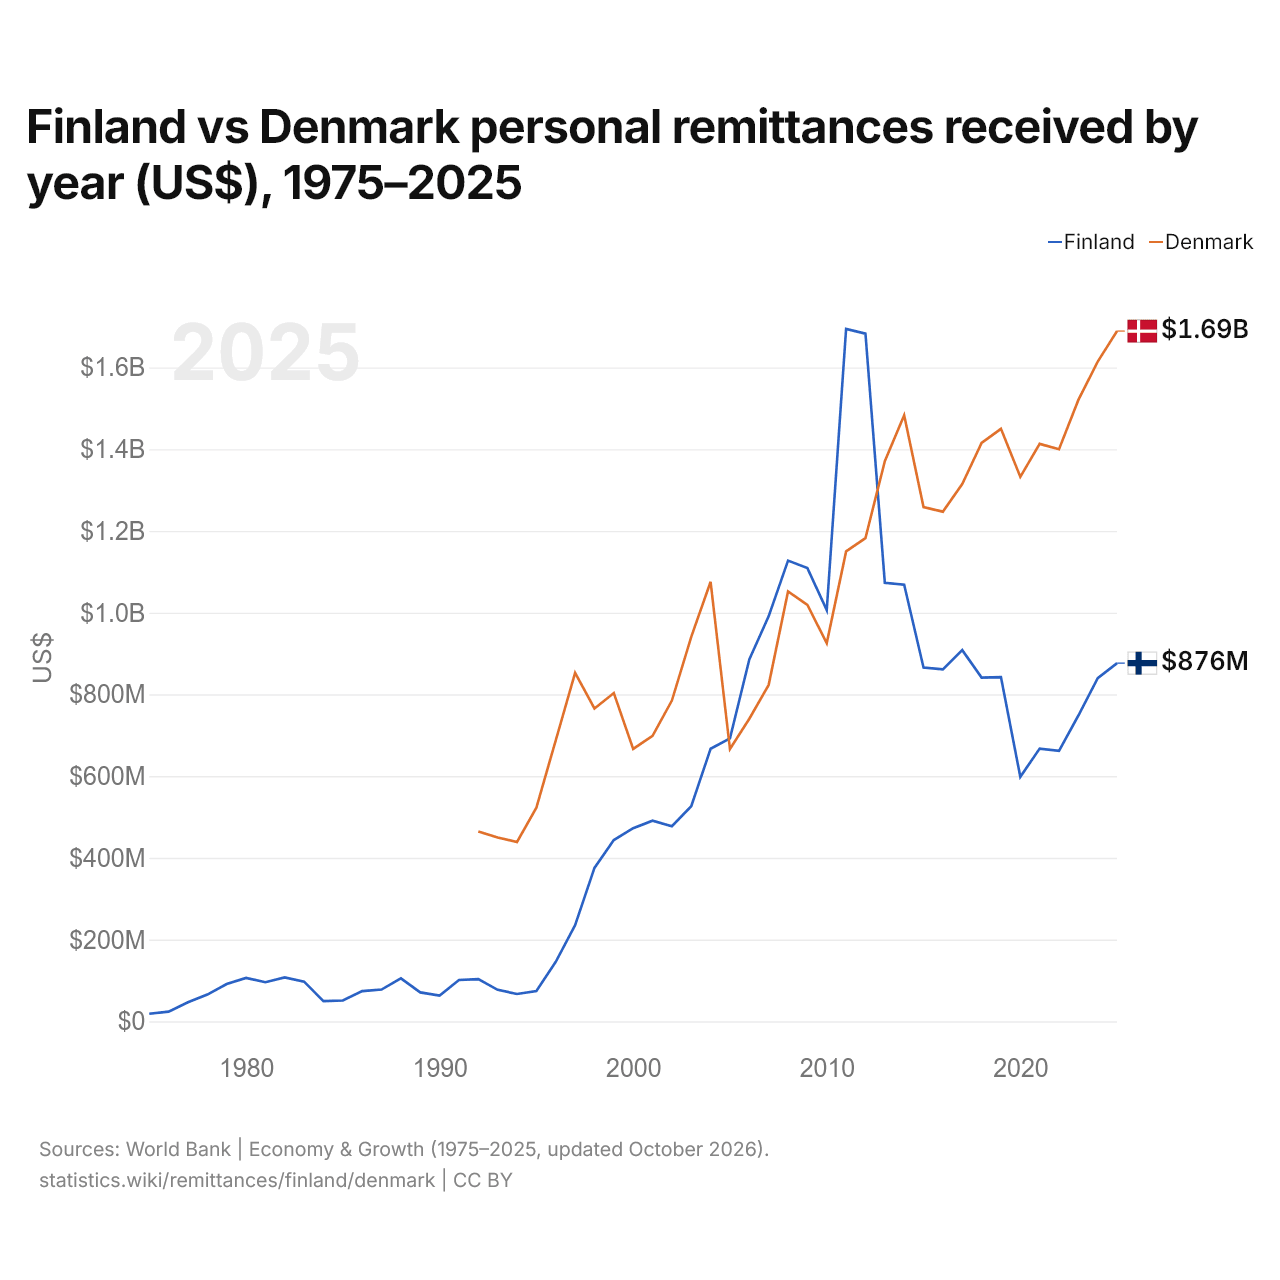
En 2025, las remesas personales recibidas fueron de 876 millones de US$ en Finlandia y de 1,69 mil millones de US$ en Dinamarca: 1,9 veces más en Dinamarca. En 1992, las remesas recibidas fueron 4,5 veces mayores en Dinamarca: 103 millones de US$ en Finlandia y 464 millones de US$ en Dinamarca.
Las remesas personales recibidas en Dinamarca han sido mayores que las recibidas en Finlandia todos los años desde 2013.
Finlandia vs Dinamarca: remesas personales recibidas, % del PIB por año, 1975–2025
| Año | % del PIB | |
|---|---|---|
|
Finlandia
|
Dinamarca
|
|
| 2025 | 0,3 % | 0,4 % |
| 2024 | 0,3 % | 0,4 % |
| 2023 | 0,3 % | 0,4 % |
| 2022 | 0,2 % | 0,3 % |
| 2021 | 0,2 % | 0,3 % |
| 2020 | 0,2 % | 0,4 % |
| 2019 | 0,3 % | 0,4 % |
| 2018 | 0,3 % | 0,4 % |
| 2017 | 0,4 % | 0,4 % |
| 2016 | 0,4 % | 0,4 % |
| 2015 | 0,4 % | 0,4 % |
| 2014 | 0,4 % | 0,4 % |
| 2013 | 0,4 % | 0,4 % |
| 2012 | 0,7 % | 0,4 % |
| 2011 | 0,6 % | 0,3 % |
| 2010 | 0,4 % | 0,3 % |
| 2009 | 0,4 % | 0,3 % |
| 2008 | 0,4 % | 0,3 % |
| 2007 | 0,4 % | 0,3 % |
| 2006 | 0,4 % | 0,3 % |
| 2005 | 0,3 % | 0,3 % |
| 2004 | 0,3 % | 0,4 % |
| 2003 | 0,3 % | 0,4 % |
| 2002 | 0,3 % | 0,4 % |
| 2001 | 0,4 % | 0,4 % |
| 2000 | 0,4 % | 0,4 % |
| 1999 | 0,3 % | 0,5 % |
| 1998 | 0,3 % | 0,4 % |
| 1997 | 0,2 % | 0,5 % |
| 1996 | 0,1 % | 0,4 % |
| 1995 | 0,1 % | 0,3 % |
| 1994 | 0,1 % | 0,3 % |
| 1993 | 0,1 % | 0,3 % |
| 1992 | 0,1 % | 0,3 % |
| 1991 | 0,1 % | - |
| 1990 | 0 % | - |
| 1989 | 0,1 % | - |
| 1988 | 0,1 % | - |
| 1987 | 0,1 % | - |
| 1986 | 0,1 % | - |
| 1985 | 0,1 % | - |
| 1984 | 0,1 % | - |
| 1983 | 0,2 % | - |
| 1982 | 0,2 % | - |
| 1981 | 0,2 % | - |
| 1980 | 0,2 % | - |
| 1979 | 0,2 % | - |
| 1978 | 0,2 % | - |
| 1977 | 0,1 % | - |
| 1976 | 0,1 % | - |
| 1975 | 0,1 % | - |
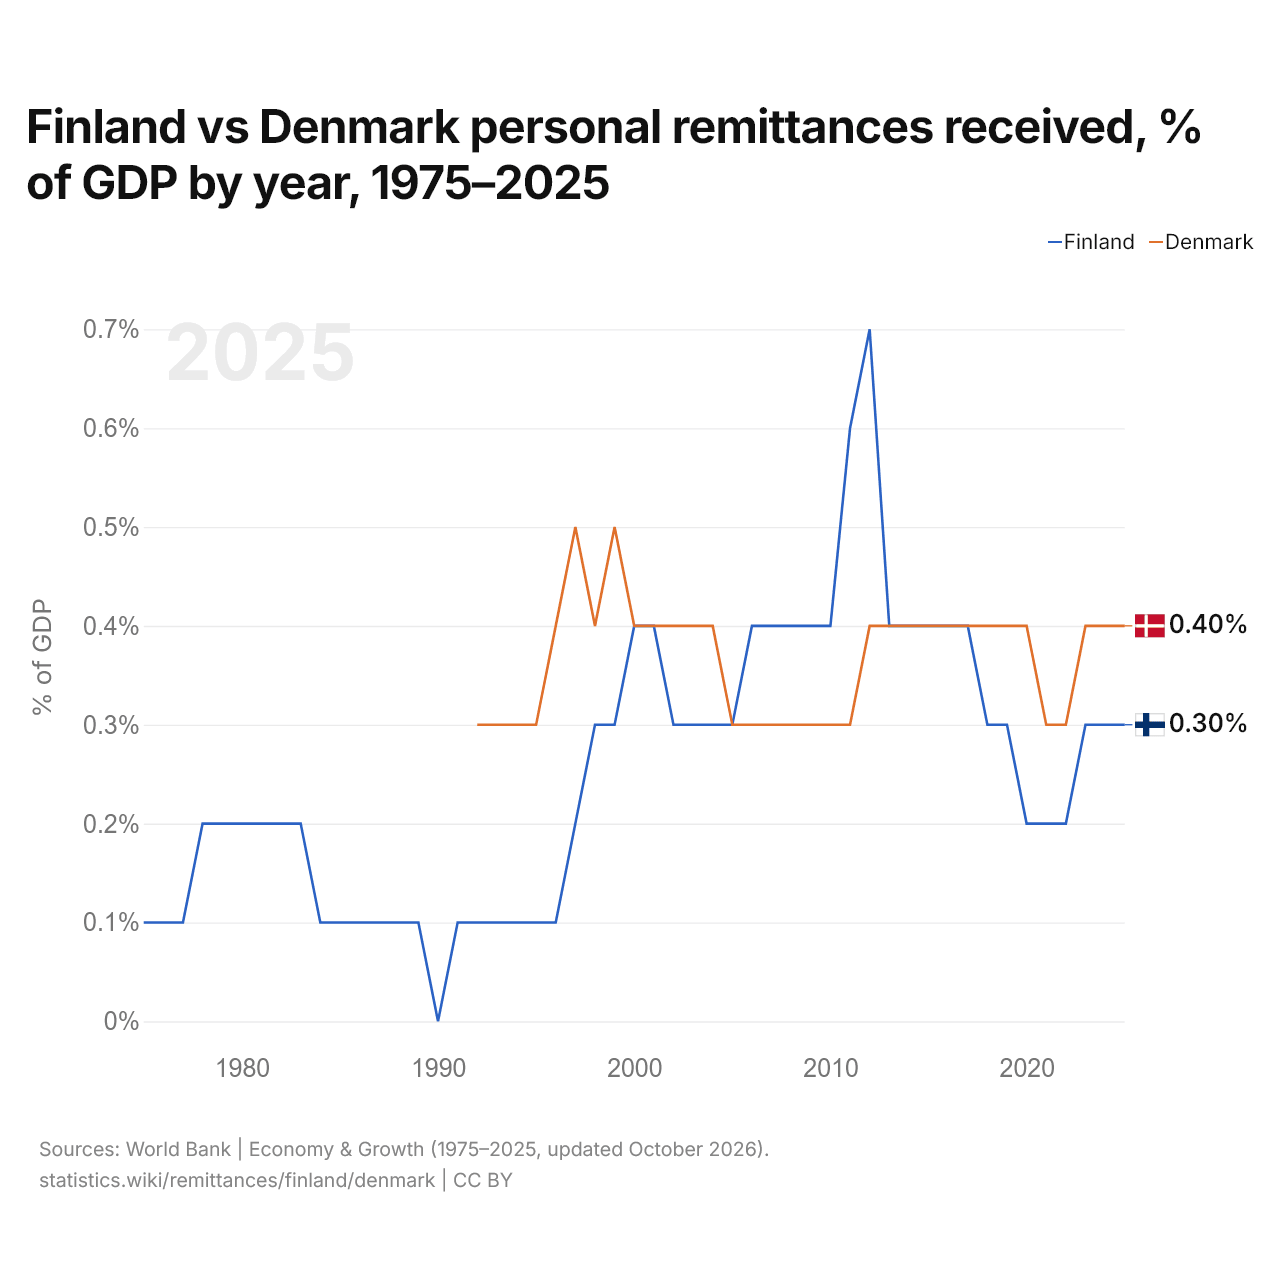
En 2025, las remesas recibidas equivalieron al 0,3 % del PIB en Finlandia y al 0,4 % en Dinamarca: 0,1 puntos porcentuales más en Dinamarca. En 2015, los porcentajes eran del 0,4 % en Finlandia y del 0,4 % en Dinamarca.
Finlandia vs Dinamarca: últimas remesas en US$ y % del PIB
|
Finlandia
|
Dinamarca
|
|
|---|---|---|
| Remesas recibidas | 876 M US$ | 1690 M US$ |
| % del PIB | 0,3 % | 0,4 % |
| Puesto mundial | 97/181 | 77/181 |
Comparar las remesas recibidas por 2 países cualesquiera
Fuentes:
- Banco Mundial | Economía y crecimiento (1975–2025, actualizado en octubre de 2026)
Creative Commons Atribución (CC BY): puedes copiar, compartir, adaptar y reutilizar este contenido, también con fines comerciales, siempre que cites a statistics.wiki e indiques los cambios que hayas hecho. Las fuentes indicadas arriba pueden tener sus propias condiciones de licencia.