
Somalia vs Eritrea: gasto militar (US$), 1961–2025
1x
| Año | US$ | |
|---|---|---|
 Somalia |
 Eritrea |
|
| 2025 | 200.256.996 US$ | - |
| 2024 | 198.633.897 US$ | - |
| 2023 | 138.756.711 US$ | - |
| 2022 | 118.661.000 US$ | - |
| 2021 | 111.017.293 US$ | - |
| 2020 | 98.156.600 US$ | - |
| 2019 | 71.728.287 US$ | - |
| 2018 | 76.562.000 US$ | - |
| 2017 | 57.090.146 US$ | - |
| 2016 | 42.689.112 US$ | - |
| 2015 | 41.920.228 US$ | - |
| 2014 | 53.574.718 US$ | - |
| 2013 | 22.471.983 US$ | - |
| 2012 | - | - |
| 2011 | - | - |
| 2010 | - | - |
| 2009 | - | - |
| 2008 | - | - |
| 2007 | - | - |
| 2006 | - | - |
| 2005 | - | - |
| 2004 | - | - |
| 2003 | - | 181.583.787 US$ |
| 2002 | - | 150.764.491 US$ |
| 2001 | - | 166.550.952 US$ |
| 2000 | - | 230.670.131 US$ |
| 1999 | - | 236.834.820 US$ |
| 1998 | - | 242.273.144 US$ |
| 1997 | - | 81.420.573 US$ |
| 1996 | - | 141.098.635 US$ |
| 1995 | - | 112.939.123 US$ |
| 1994 | - | 67.609.177 US$ |
| 1993 | - | 99.793.104 US$ |
| 1992 | - | - |
| 1991 | - | - |
| 1990 | - | - |
| 1989 | 18.074.728 US$ | - |
| 1988 | 183.353.469 US$ | - |
| 1987 | 172.779.158 US$ | - |
| 1986 | 265.336.915 US$ | - |
| 1985 | 444.066 US$ | - |
| 1984 | 1.127.036 US$ | - |
| 1983 | 1.760.013 US$ | - |
| 1982 | 2.232.853 US$ | - |
| 1981 | 4.249.729 US$ | - |
| 1980 | 3.312.240 US$ | - |
| 1979 | 5.746.279 US$ | - |
| 1978 | 5.617.424 US$ | - |
| 1977 | 2.297.101 US$ | - |
| 1976 | 4.509.318 US$ | - |
| 1975 | 3.907.724 US$ | - |
| 1974 | 4.162.958 US$ | - |
| 1973 | 2.445.075 US$ | - |
| 1972 | 2.031.638 US$ | - |
| 1971 | 1.676.377 US$ | - |
| 1970 | 1.726.057 US$ | - |
| 1969 | 1.285.415 US$ | - |
| 1968 | 1.167.600 US$ | - |
| 1967 | 1.054.362 US$ | - |
| 1966 | 910.198 US$ | - |
| 1965 | 723.758 US$ | - |
| 1964 | 758.568 US$ | - |
| 1963 | 627.159 US$ | - |
| 1962 | 517.929 US$ | - |
| 1961 | 442.400 US$ | - |
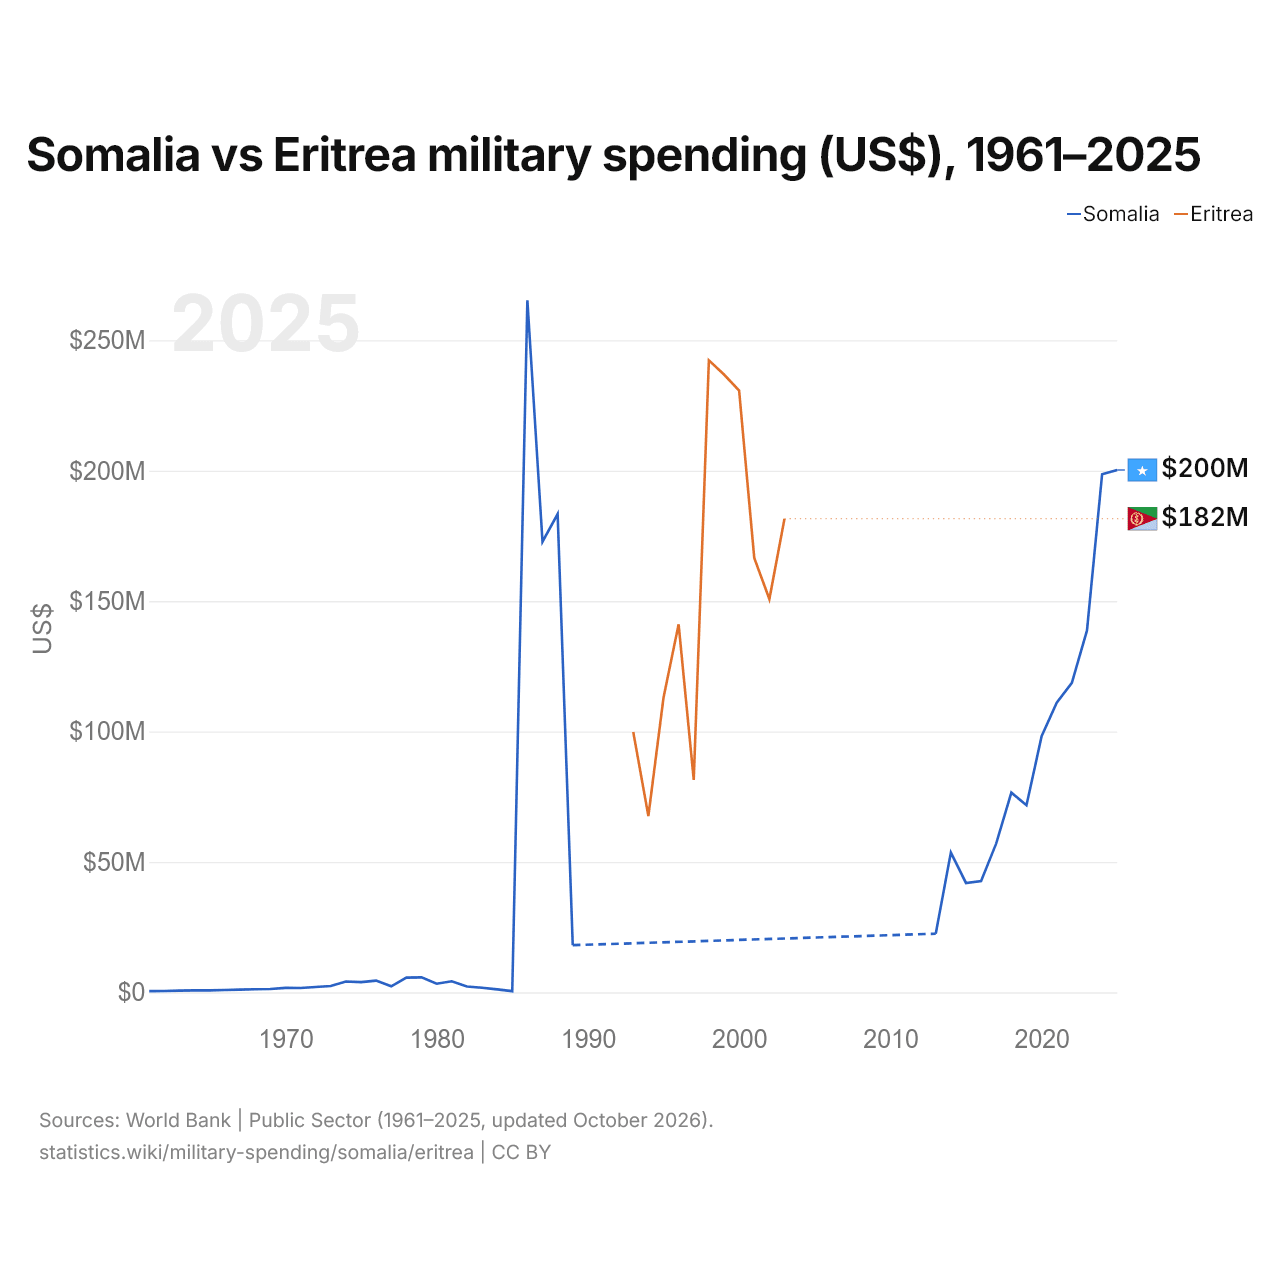
El gasto militar de Somalia es de 200 millones de US$ (2025), y el de Eritrea, de 182 millones de US$ (2003).
Somalia vs Eritrea: gasto militar en % del PIB, 1961–2025
| Año | % del PIB | |
|---|---|---|
|
Somalia
|
Eritrea
|
|
| 2025 | 1,5 % | - |
| 2024 | 1,7 % | - |
| 2023 | 1,3 % | - |
| 2022 | 1,2 % | - |
| 2021 | 1,2 % | - |
| 2020 | 1,1 % | - |
| 2019 | 0,8 % | - |
| 2018 | 1 % | - |
| 2017 | 0,7 % | - |
| 2016 | 0,6 % | - |
| 2015 | 0,7 % | - |
| 2014 | 0,9 % | - |
| 2013 | 0,4 % | - |
| 2012 | - | - |
| 2011 | - | - |
| 2010 | - | - |
| 2009 | - | - |
| 2008 | - | - |
| 2007 | - | - |
| 2006 | - | - |
| 2005 | - | - |
| 2004 | - | - |
| 2003 | - | 20,9 % |
| 2002 | - | 20,7 % |
| 2001 | - | 22,1 % |
| 2000 | - | 32,7 % |
| 1999 | - | 34,4 % |
| 1998 | - | 32,5 % |
| 1997 | - | 11,9 % |
| 1996 | - | 20,3 % |
| 1995 | - | 19,5 % |
| 1994 | - | 12,7 % |
| 1993 | - | 21,3 % |
| 1992 | - | - |
| 1991 | - | - |
| 1990 | - | - |
| 1989 | 1,5 % | - |
| 1988 | 17,4 % | - |
| 1987 | 17 % | - |
| 1986 | 28,9 % | - |
| 1985 | 0,1 % | - |
| 1984 | 0,1 % | - |
| 1983 | 0,2 % | - |
| 1982 | 0,3 % | - |
| 1981 | 0,6 % | - |
| 1980 | 0,5 % | - |
| 1979 | 1 % | - |
| 1978 | 1 % | - |
| 1977 | 0,5 % | - |
| 1976 | 0,5 % | - |
| 1975 | 0,5 % | - |
| 1974 | 0,7 % | - |
| 1973 | 0,5 % | - |
| 1972 | 0,5 % | - |
| 1971 | 0,5 % | - |
| 1970 | 0,5 % | - |
| 1969 | 0,4 % | - |
| 1968 | 0,4 % | - |
| 1967 | 0,4 % | - |
| 1966 | 0,4 % | - |
| 1965 | 0,3 % | - |
| 1964 | 0,3 % | - |
| 1963 | 0,3 % | - |
| 1962 | 0,3 % | - |
| 1961 | 0,2 % | - |
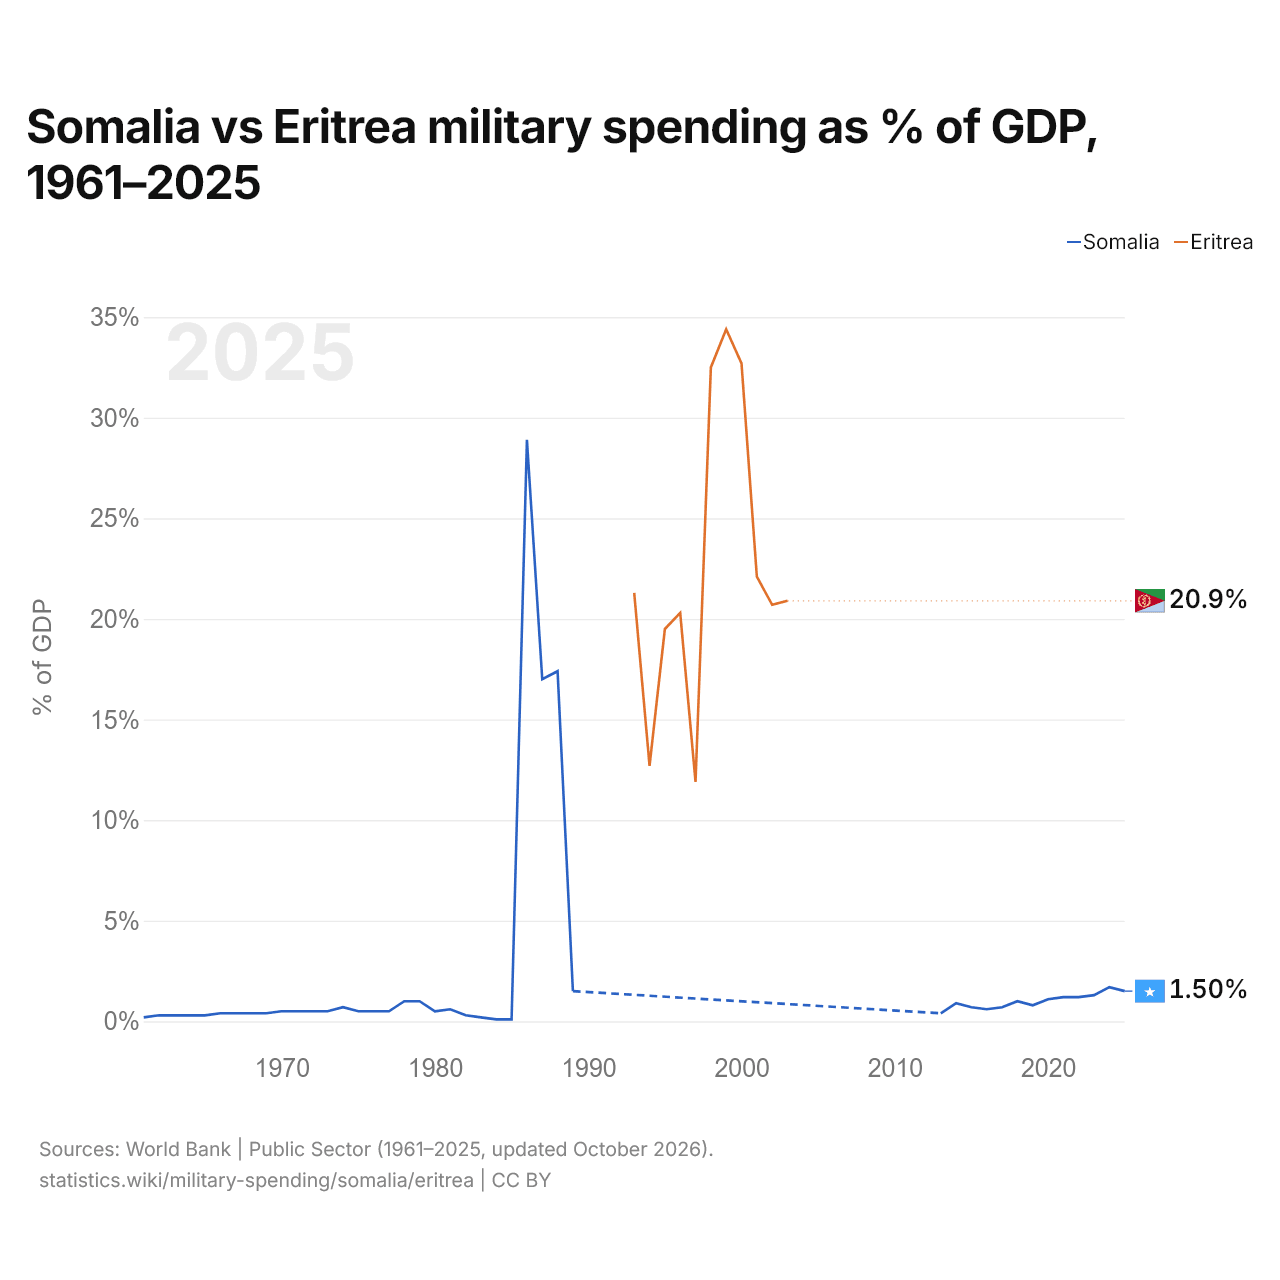
El gasto militar es del 1,5 % del PIB en Somalia (2025), y del 20,9 % en Eritrea (2003).
Somalia vs Eritrea: datos del gasto militar
|
Somalia
|
Eritrea
|
|
|---|---|---|
| US$ | 200 M US$ (2025) | 182 M US$ (2003) |
| % del PIB | 1,5 % (2025) | 20,9 % (2003) |
| Por persona, US$ | 10,2 US$ (2025) | 72,8 US$ (2003) |
| Porcentaje del mundo | 0,007 % (2025) | 0,02 % (2003) |
| Puesto mundial | 129/154 | n/d |
Comparar el gasto militar de 2 países cualesquiera
Fuentes:
- Banco Mundial | Sector público (1961–2025, actualizado en octubre de 2026)
Creative Commons Atribución (CC BY): puedes copiar, compartir, adaptar y reutilizar este contenido, también con fines comerciales, siempre que cites a statistics.wiki e indiques los cambios que hayas hecho. Las fuentes indicadas arriba pueden tener sus propias condiciones de licencia.