
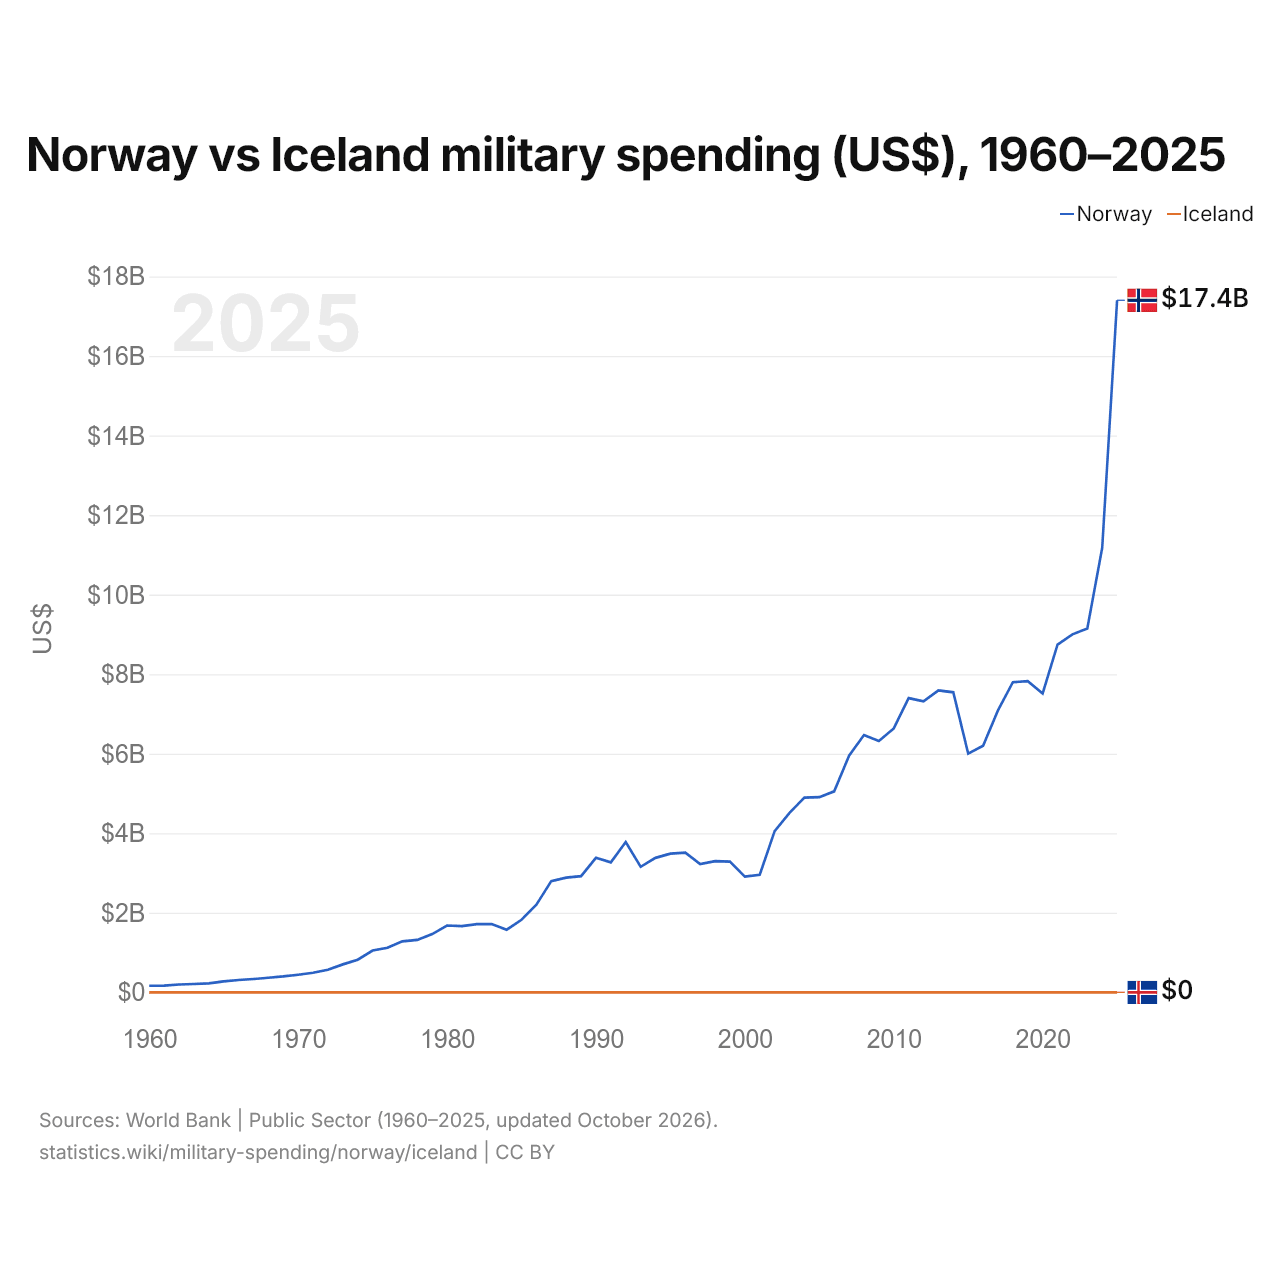
Noruega vs Islandia: gasto militar (US$), 1960–2025
| Año | US$ | |
|---|---|---|
 Noruega |
 Islandia |
|
| 2025 | 17.400.727.738 US$ | 0 US$ |
| 2024 | 11.178.024.169 US$ | 0 US$ |
| 2023 | 9.150.099.453 US$ | 0 US$ |
| 2022 | 9.000.901.775 US$ | 0 US$ |
| 2021 | 8.743.564.004 US$ | 0 US$ |
| 2020 | 7.515.022.166 US$ | 0 US$ |
| 2019 | 7.821.953.060 US$ | 0 US$ |
| 2018 | 7.797.550.984 US$ | 0 US$ |
| 2017 | 7.087.864.914 US$ | 0 US$ |
| 2016 | 6.199.020.919 US$ | 0 US$ |
| 2015 | 6.002.518.147 US$ | 0 US$ |
| 2014 | 7.542.869.668 US$ | 0 US$ |
| 2013 | 7.590.220.300 US$ | 0 US$ |
| 2012 | 7.315.402.983 US$ | 0 US$ |
| 2011 | 7.398.270.592 US$ | 0 US$ |
| 2010 | 6.635.555.157 US$ | 0 US$ |
| 2009 | 6.318.404.981 US$ | 0 US$ |
| 2008 | 6.468.801.230 US$ | 0 US$ |
| 2007 | 5.950.704.723 US$ | 0 US$ |
| 2006 | 5.053.062.799 US$ | 0 US$ |
| 2005 | 4.907.577.610 US$ | 0 US$ |
| 2004 | 4.894.667.089 US$ | 0 US$ |
| 2003 | 4.513.730.916 US$ | 0 US$ |
| 2002 | 4.054.342.965 US$ | 0 US$ |
| 2001 | 2.954.920.637 US$ | 0 US$ |
| 2000 | 2.908.092.909 US$ | 0 US$ |
| 1999 | 3.287.195.096 US$ | 0 US$ |
| 1998 | 3.297.466.855 US$ | 0 US$ |
| 1997 | 3.225.955.711 US$ | 0 US$ |
| 1996 | 3.513.375.674 US$ | 0 US$ |
| 1995 | 3.486.190.503 US$ | 0 US$ |
| 1994 | 3.381.680.163 US$ | 0 US$ |
| 1993 | 3.156.173.309 US$ | 0 US$ |
| 1992 | 3.779.288.930 US$ | 0 US$ |
| 1991 | 3.268.065.034 US$ | 0 US$ |
| 1990 | 3.382.209.992 US$ | 0 US$ |
| 1989 | 2.920.947.314 US$ | 0 US$ |
| 1988 | 2.883.298.847 US$ | 0 US$ |
| 1987 | 2.797.043.377 US$ | 0 US$ |
| 1986 | 2.202.871.919 US$ | 0 US$ |
| 1985 | 1.823.312.690 US$ | 0 US$ |
| 1984 | 1.574.141.754 US$ | 0 US$ |
| 1983 | 1.716.606.823 US$ | 0 US$ |
| 1982 | 1.714.090.051 US$ | 0 US$ |
| 1981 | 1.663.409.530 US$ | 0 US$ |
| 1980 | 1.680.802.233 US$ | 0 US$ |
| 1979 | 1.464.492.202 US$ | 0 US$ |
| 1978 | 1.317.121.484 US$ | 0 US$ |
| 1977 | 1.281.487.637 US$ | 0 US$ |
| 1976 | 1.118.885.308 US$ | 0 US$ |
| 1975 | 1.050.521.677 US$ | 0 US$ |
| 1974 | 820.608.817 US$ | 0 US$ |
| 1973 | 702.982.336 US$ | 0 US$ |
| 1972 | 568.894.736 US$ | 0 US$ |
| 1971 | 492.558.588 US$ | 0 US$ |
| 1970 | 442.908.705 US$ | 0 US$ |
| 1969 | 399.477.527 US$ | 0 US$ |
| 1968 | 367.231.746 US$ | 0 US$ |
| 1967 | 334.820.158 US$ | 0 US$ |
| 1966 | 310.859.503 US$ | 0 US$ |
| 1965 | 274.334.803 US$ | 0 US$ |
| 1964 | 223.719.863 US$ | 0 US$ |
| 1963 | 209.262.230 US$ | 0 US$ |
| 1962 | 197.025.496 US$ | 0 US$ |
| 1961 | 169.523.276 US$ | 0 US$ |
| 1960 | 165.552.499 US$ | 0 US$ |
En 2025, el gasto militar fue de 17,4 mil millones de US$ en Noruega y de 0 US$ en Islandia: un 0 % más en Noruega. En 1960 fue de 166 millones de US$ en Noruega y de 0 US$ en Islandia, un 0 % más en Noruega.
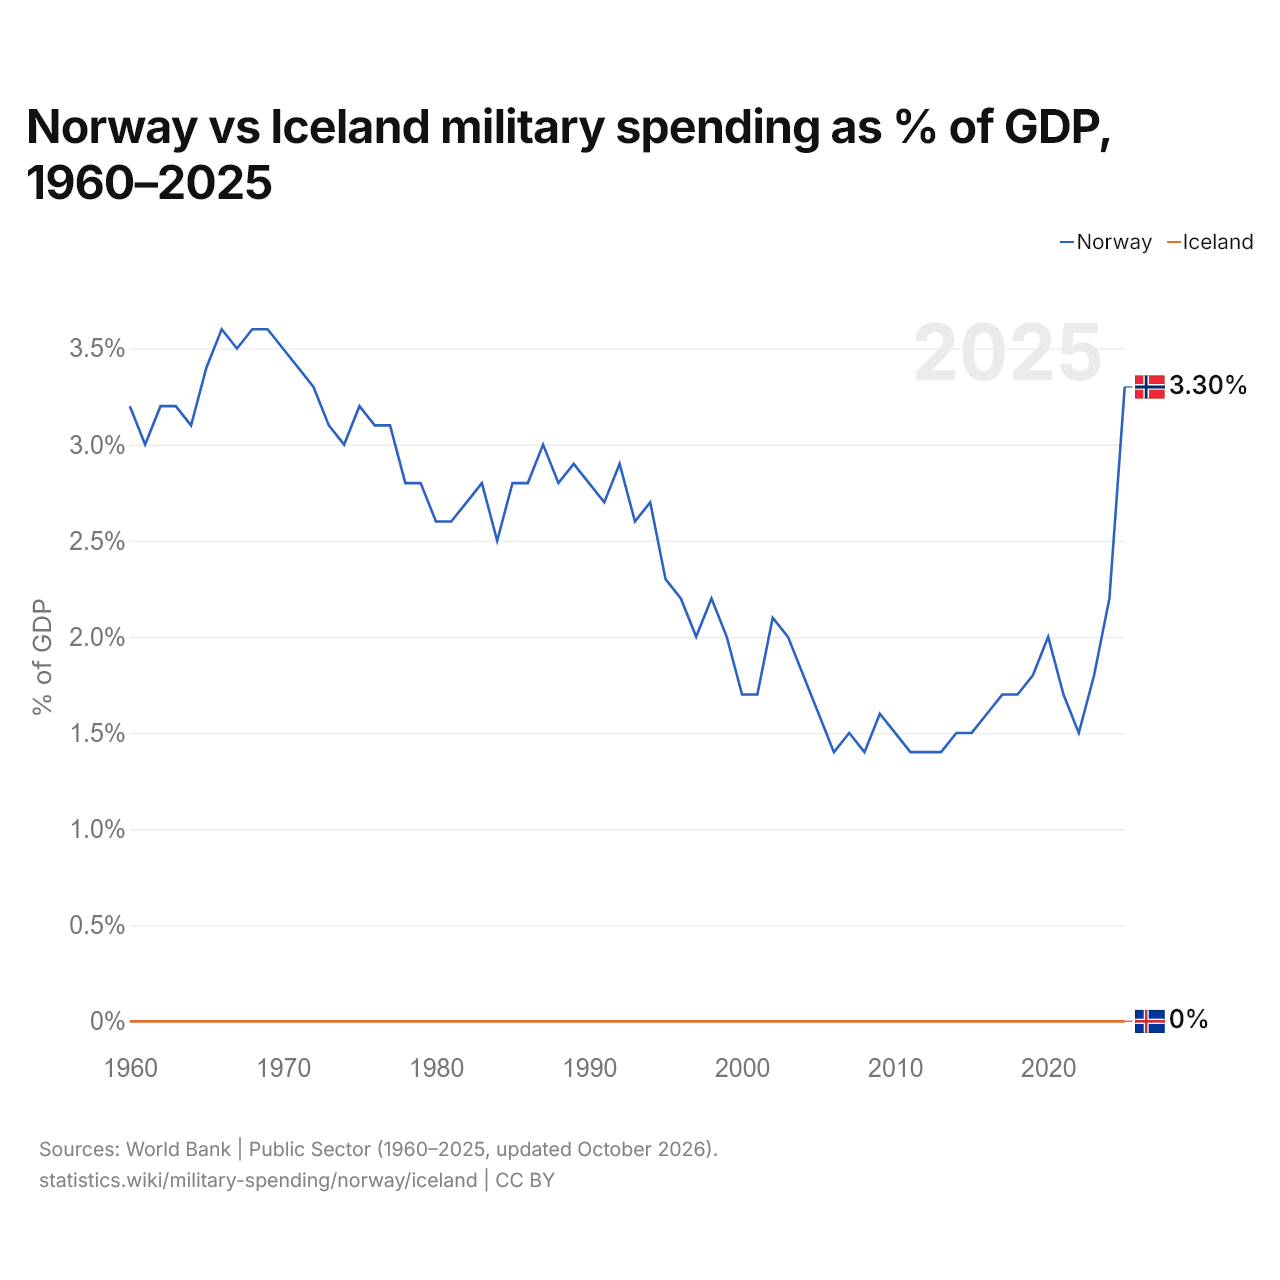
Noruega vs Islandia: gasto militar en % del PIB, 1960–2025
| Año | % del PIB | |
|---|---|---|
|
Noruega
|
Islandia
|
|
| 2025 | 3,3 % | 0 % |
| 2024 | 2,2 % | 0 % |
| 2023 | 1,8 % | 0 % |
| 2022 | 1,5 % | 0 % |
| 2021 | 1,7 % | 0 % |
| 2020 | 2 % | 0 % |
| 2019 | 1,8 % | 0 % |
| 2018 | 1,7 % | 0 % |
| 2017 | 1,7 % | 0 % |
| 2016 | 1,6 % | 0 % |
| 2015 | 1,5 % | 0 % |
| 2014 | 1,5 % | 0 % |
| 2013 | 1,4 % | 0 % |
| 2012 | 1,4 % | 0 % |
| 2011 | 1,4 % | 0 % |
| 2010 | 1,5 % | 0 % |
| 2009 | 1,6 % | 0 % |
| 2008 | 1,4 % | 0 % |
| 2007 | 1,5 % | 0 % |
| 2006 | 1,4 % | 0 % |
| 2005 | 1,6 % | 0 % |
| 2004 | 1,8 % | 0 % |
| 2003 | 2 % | 0 % |
| 2002 | 2,1 % | 0 % |
| 2001 | 1,7 % | 0 % |
| 2000 | 1,7 % | 0 % |
| 1999 | 2 % | 0 % |
| 1998 | 2,2 % | 0 % |
| 1997 | 2 % | 0 % |
| 1996 | 2,2 % | 0 % |
| 1995 | 2,3 % | 0 % |
| 1994 | 2,7 % | 0 % |
| 1993 | 2,6 % | 0 % |
| 1992 | 2,9 % | 0 % |
| 1991 | 2,7 % | 0 % |
| 1990 | 2,8 % | 0 % |
| 1989 | 2,9 % | 0 % |
| 1988 | 2,8 % | 0 % |
| 1987 | 3 % | 0 % |
| 1986 | 2,8 % | 0 % |
| 1985 | 2,8 % | 0 % |
| 1984 | 2,5 % | 0 % |
| 1983 | 2,8 % | 0 % |
| 1982 | 2,7 % | 0 % |
| 1981 | 2,6 % | 0 % |
| 1980 | 2,6 % | 0 % |
| 1979 | 2,8 % | 0 % |
| 1978 | 2,8 % | 0 % |
| 1977 | 3,1 % | 0 % |
| 1976 | 3,1 % | 0 % |
| 1975 | 3,2 % | 0 % |
| 1974 | 3 % | 0 % |
| 1973 | 3,1 % | 0 % |
| 1972 | 3,3 % | 0 % |
| 1971 | 3,4 % | 0 % |
| 1970 | 3,5 % | 0 % |
| 1969 | 3,6 % | 0 % |
| 1968 | 3,6 % | 0 % |
| 1967 | 3,5 % | 0 % |
| 1966 | 3,6 % | 0 % |
| 1965 | 3,4 % | 0 % |
| 1964 | 3,1 % | 0 % |
| 1963 | 3,2 % | 0 % |
| 1962 | 3,2 % | 0 % |
| 1961 | 3 % | 0 % |
| 1960 | 3,2 % | 0 % |
En 2025, el gasto militar fue del 3,3 % del PIB en Noruega y del 0,0 % en Islandia: 3,3 puntos porcentuales más en Noruega. En 2015 fue del 1,5 % en Noruega y del 0,0 % en Islandia, 1,5 puntos porcentuales más en Noruega.
El gasto militar de Noruega, como porcentaje del PIB, ha sido más alto que el de Islandia todos los años desde 1960. La diferencia fue máxima en 1968, cuando el gasto militar de Noruega superó al de Islandia en 3,6 puntos porcentuales del PIB.
Noruega vs Islandia: datos del gasto militar
|
Noruega
|
Islandia
|
|
|---|---|---|
| US$, 2025 | 17,4 mil M US$ | 0 US$ |
| % del PIB, 2025 | 3,3 % | 0,0 % |
| Por persona, US$ | 3101 US$ | 0 US$ |
| Porcentaje del mundo | 0,61 % | 0 % |
| Puesto mundial | 23/154 | 153/154 |
Comparar el gasto militar de 2 países cualesquiera
Fuentes:
- Banco Mundial | Sector público (1960–2025, actualizado en octubre de 2026)
Creative Commons Atribución (CC BY): puedes copiar, compartir, adaptar y reutilizar este contenido, también con fines comerciales, siempre que cites a statistics.wiki e indiques los cambios que hayas hecho. Las fuentes indicadas arriba pueden tener sus propias condiciones de licencia.