
Malasia vs Irán: gasto militar (US$), 1960–2025
| Año | US$ | |
|---|---|---|
 Malasia |
 Irán |
|
| 2025 | 4.892.030.519 US$ | 7.585.783.794 US$ |
| 2024 | 4.378.972.081 US$ | 10.544.798.901 US$ |
| 2023 | 3.919.797.526 US$ | 11.409.446.462 US$ |
| 2022 | 3.673.514.857 US$ | 9.459.492.512 US$ |
| 2021 | 3.672.982.691 US$ | 9.440.843.617 US$ |
| 2020 | 3.373.393.772 US$ | 6.115.969.218 US$ |
| 2019 | 3.262.546.258 US$ | 7.471.128.101 US$ |
| 2018 | 3.444.746.514 US$ | 9.705.656.467 US$ |
| 2017 | 3.511.267.798 US$ | 14.512.949.474 US$ |
| 2016 | 4.170.392.097 US$ | 13.384.245.776 US$ |
| 2015 | 4.532.077.120 US$ | 10.463.402.998 US$ |
| 2014 | 4.919.243.753 US$ | 9.784.521.436 US$ |
| 2013 | 4.846.867.017 US$ | 10.912.579.140 US$ |
| 2012 | 4.444.120.150 US$ | 17.302.277.456 US$ |
| 2011 | 4.626.751.824 US$ | 14.982.440.345 US$ |
| 2010 | 3.800.298.620 US$ | 13.572.427.670 US$ |
| 2009 | 3.785.221.827 US$ | 12.619.302.014 US$ |
| 2008 | 4.211.951.355 US$ | 10.896.272.017 US$ |
| 2007 | 3.790.673.220 US$ | 9.281.949.067 US$ |
| 2006 | 3.266.205.550 US$ | 8.805.227.250 US$ |
| 2005 | 3.120.336.131 US$ | 6.831.572.900 US$ |
| 2004 | 2.823.157.895 US$ | 5.322.011.853 US$ |
| 2003 | 2.881.578.947 US$ | 3.653.526.060 US$ |
| 2002 | 2.237.894.737 US$ | 2.797.090.548 US$ |
| 2001 | 1.934.473.684 US$ | 3.068.155.672 US$ |
| 2000 | 1.533.157.895 US$ | 2.515.175.965 US$ |
| 1999 | 1.663.289.474 US$ | 2.737.544.885 US$ |
| 1998 | 1.158.530.371 US$ | 2.899.267.444 US$ |
| 1997 | 2.085.669.671 US$ | 2.846.697.182 US$ |
| 1996 | 2.421.098.656 US$ | 2.702.905.136 US$ |
| 1995 | 2.440.590.112 US$ | 2.077.030.068 US$ |
| 1994 | 2.120.484.682 US$ | 1.489.280.678 US$ |
| 1993 | 1.923.394.436 US$ | 1.083.871.838 US$ |
| 1992 | 1.766.992.579 US$ | 2.143.027.713 US$ |
| 1991 | 1.572.228.688 US$ | 2.856.152.904 US$ |
| 1990 | 1.125.005.777 US$ | 3.672.817.667 US$ |
| 1989 | 1.019.254.722 US$ | 5.492.200.716 US$ |
| 1988 | 855.741.006 US$ | 7.715.454.251 US$ |
| 1987 | 1.334.715.542 US$ | 7.891.993.107 US$ |
| 1986 | 894.073.932 US$ | 12.711.560.920 US$ |
| 1985 | 1.076.904.861 US$ | 11.734.311.920 US$ |
| 1984 | 1.273.658.690 US$ | 10.312.448.927 US$ |
| 1983 | 1.342.380.183 US$ | 11.097.361.274 US$ |
| 1982 | 1.438.762.111 US$ | 9.958.630.432 US$ |
| 1981 | 1.446.536.104 US$ | 8.231.276.439 US$ |
| 1980 | 1.035.884.795 US$ | 5.041.918.103 US$ |
| 1979 | 778.636.126 US$ | 5.240.240.422 US$ |
| 1978 | 607.070.165 US$ | 8.667.668.366 US$ |
| 1977 | 637.878.700 US$ | 8.213.015.603 US$ |
| 1976 | 439.884.717 US$ | 7.654.840.763 US$ |
| 1975 | 439.290.473 US$ | 6.248.972.157 US$ |
| 1974 | 397.163.851 US$ | 4.043.457.403 US$ |
| 1973 | 296.726.189 US$ | 504.993.895 US$ |
| 1972 | 251.103.365 US$ | 390.304.805 US$ |
| 1971 | 228.027.756 US$ | 418.409.746 US$ |
| 1970 | 199.593.626 US$ | 642.868.064 US$ |
| 1969 | 143.733.544 US$ | 581.570.299 US$ |
| 1968 | 148.306.884 US$ | 446.366.785 US$ |
| 1967 | 143.406.877 US$ | 336.818.382 US$ |
| 1966 | 148.633.551 US$ | 259.307.443 US$ |
| 1965 | 118.580.174 US$ | 201.383.454 US$ |
| 1964 | 84.606.791 US$ | 155.037.831 US$ |
| 1963 | 60.760.089 US$ | 127.669.059 US$ |
| 1962 | 43.773.398 US$ | 108.299.862 US$ |
| 1961 | 42.466.729 US$ | 103.884.655 US$ |
| 1960 | 51.286.742 US$ | 96.366.306 US$ |
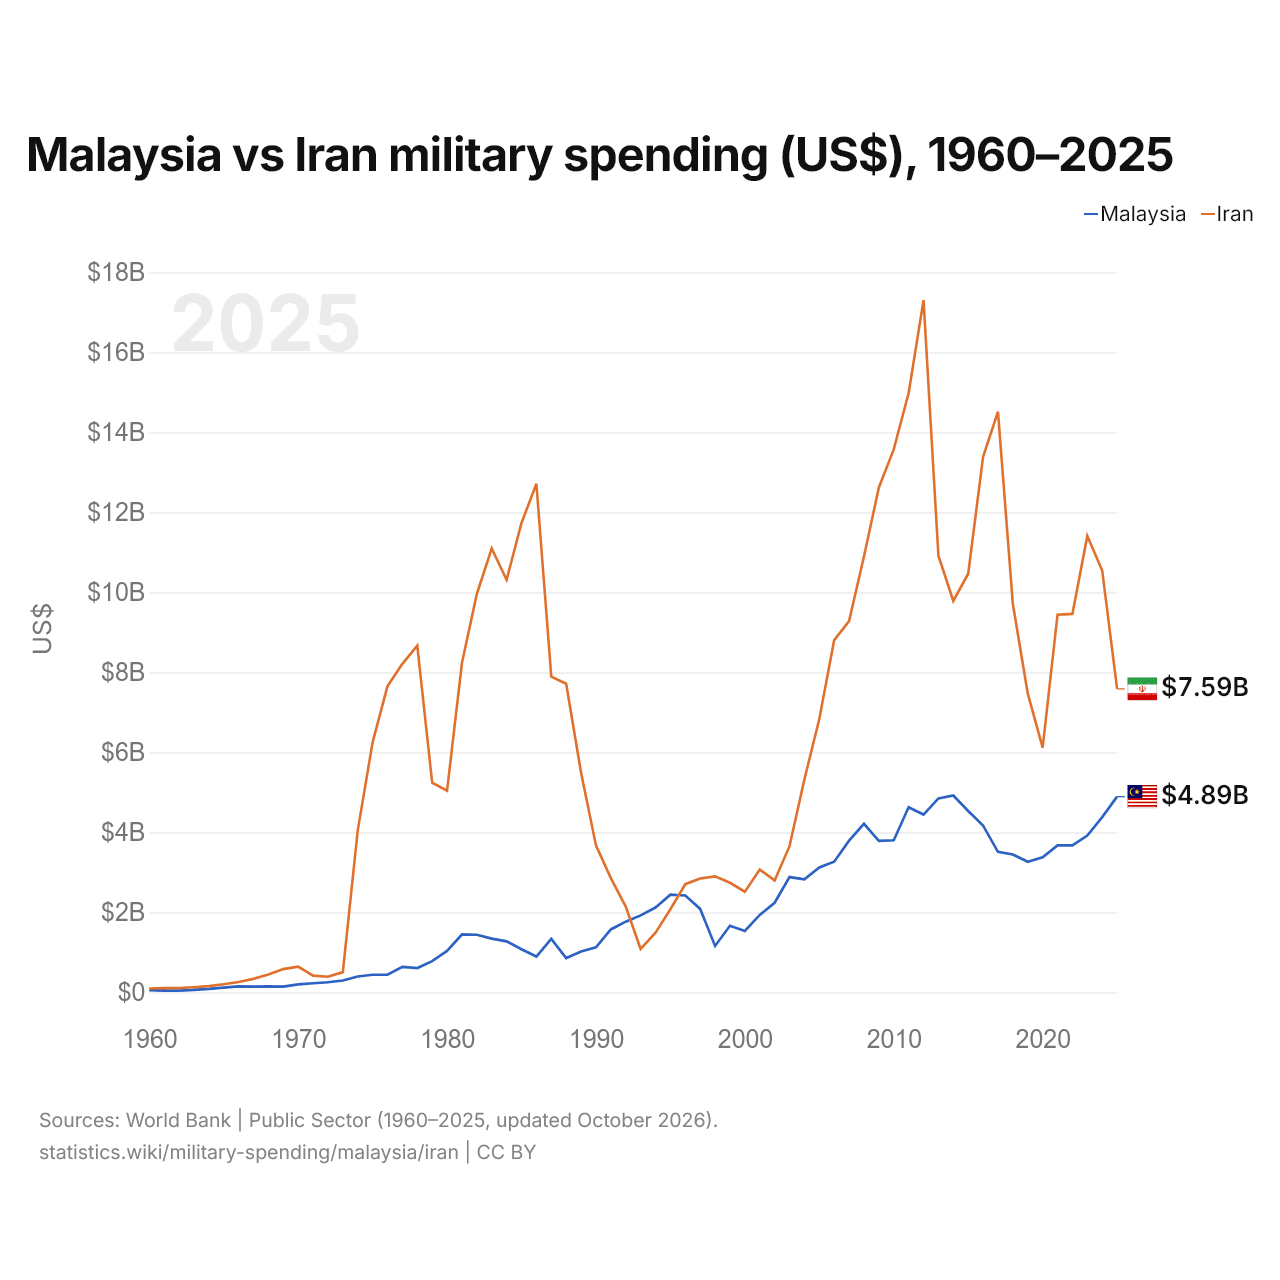
En 2025, el gasto militar fue de 4,89 mil millones de US$ en Malasia y de 7,59 mil millones de US$ en Irán: 1,6 veces más en Irán. En 1960 fue de 51,3 millones de US$ en Malasia y de 96,4 millones de US$ en Irán, 1,9 veces más en Irán.
Malasia vs Irán: gasto militar en % del PIB, 1960–2025
| Año | % del PIB | |
|---|---|---|
|
Malasia
|
Irán
|
|
| 2025 | 1 % | 2,1 % |
| 2024 | 1 % | 2,2 % |
| 2023 | 1 % | 2,5 % |
| 2022 | 0,9 % | 2,2 % |
| 2021 | 1 % | 2,3 % |
| 2020 | 1 % | 2,2 % |
| 2019 | 0,9 % | 2,1 % |
| 2018 | 1 % | 2,4 % |
| 2017 | 1,1 % | 2,8 % |
| 2016 | 1,4 % | 2,8 % |
| 2015 | 1,5 % | 2,6 % |
| 2014 | 1,5 % | 2,1 % |
| 2013 | 1,5 % | 2,2 % |
| 2012 | 1,4 % | 2,7 % |
| 2011 | 1,6 % | 2,4 % |
| 2010 | 1,5 % | 2,8 % |
| 2009 | 1,9 % | 3 % |
| 2008 | 1,8 % | 2,7 % |
| 2007 | 2 % | 2,7 % |
| 2006 | 2 % | 3,3 % |
| 2005 | 2,2 % | 3 % |
| 2004 | 2,3 % | 2,8 % |
| 2003 | 2,6 % | 2,4 % |
| 2002 | 2,2 % | 2,2 % |
| 2001 | 2,1 % | 2,4 % |
| 2000 | 1,6 % | 2,3 % |
| 1999 | 2,1 % | 2,4 % |
| 1998 | 1,6 % | 2,6 % |
| 1997 | 2,1 % | 2,5 % |
| 1996 | 2,4 % | 2,2 % |
| 1995 | 2,8 % | 2,2 % |
| 1994 | 2,8 % | 2,1 % |
| 1993 | 2,9 % | 1,7 % |
| 1992 | 3 % | 1,8 % |
| 1991 | 3,2 % | 2,2 % |
| 1990 | 2,6 % | 2,9 % |
| 1989 | 2,6 % | 4,6 % |
| 1988 | 2,4 % | 6,3 % |
| 1987 | 4,1 % | 5,9 % |
| 1986 | 3,2 % | 6,1 % |
| 1985 | 3,5 % | 6,5 % |
| 1984 | 3,8 % | 6,4 % |
| 1983 | 4,4 % | 7,1 % |
| 1982 | 5,4 % | 7,9 % |
| 1981 | 5,8 % | 8,2 % |
| 1980 | 4,2 % | 5,3 % |
| 1979 | 3,7 % | 5,8 % |
| 1978 | 3,7 % | 11,1 % |
| 1977 | 4,9 % | 10,2 % |
| 1976 | 4 % | 11,2 % |
| 1975 | 4,7 % | 12,1 % |
| 1974 | 4,2 % | 8,8 % |
| 1973 | 3,9 % | 1,9 % |
| 1972 | 5 % | 2,3 % |
| 1971 | 5,4 % | 3 % |
| 1970 | 5,2 % | 5,9 % |
| 1969 | 3,9 % | 6 % |
| 1968 | 4,5 % | 5,2 % |
| 1967 | 4,5 % | 4,5 % |
| 1966 | 4,7 % | 3,8 % |
| 1965 | 4 % | 3,2 % |
| 1964 | 3,2 % | 2,9 % |
| 1963 | 2,4 % | 2,6 % |
| 1962 | 2,2 % | 2,3 % |
| 1961 | 2,2 % | 2,3 % |
| 1960 | 2,7 % | 2,3 % |
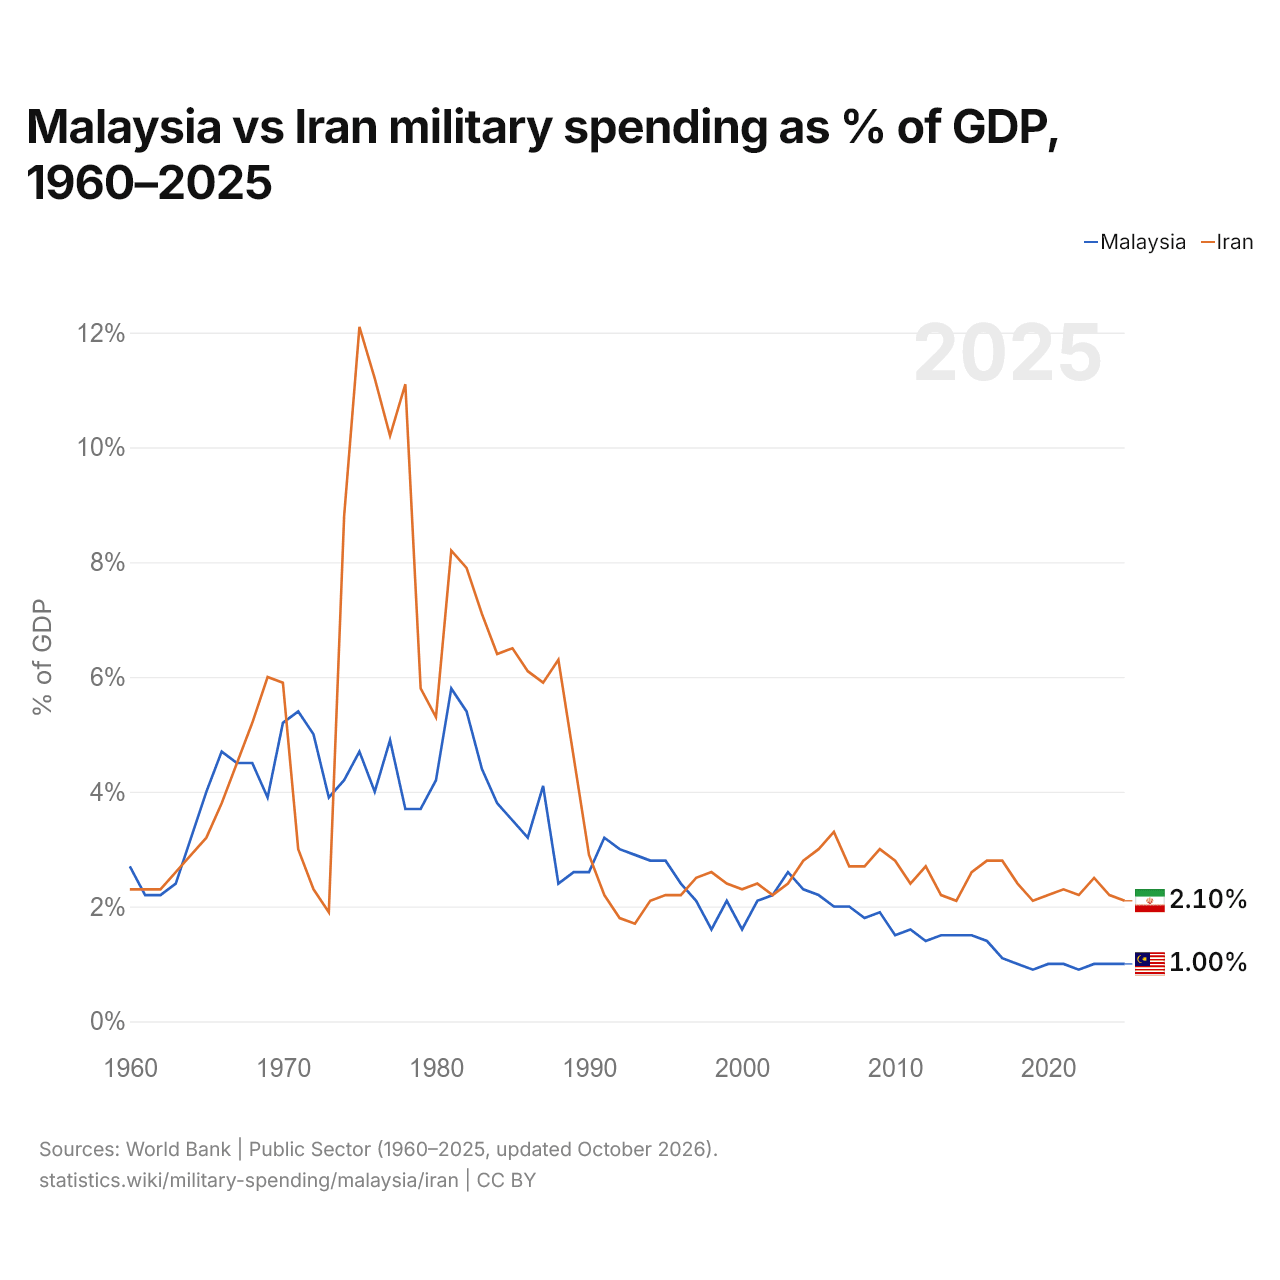
En 2025, el gasto militar fue del 1,0 % del PIB en Malasia y del 2,1 % en Irán: 1,1 puntos porcentuales más en Irán. En 2015 fue del 1,5 % en Malasia y del 2,6 % en Irán, 1,1 puntos porcentuales más en Irán.
El gasto militar de Irán, como porcentaje del PIB, ha sido más alto que el de Malasia todos los años desde 2004. La diferencia fue máxima en 1978, cuando el gasto militar de Irán superó al de Malasia en 7,4 puntos porcentuales del PIB.
Malasia vs Irán: datos del gasto militar
|
Malasia
|
Irán
|
|
|---|---|---|
| US$, 2025 | 4890 M US$ | 7590 M US$ |
| % del PIB, 2025 | 1,0 % | 2,1 % |
| Por persona, US$ | 136 US$ | 82,1 US$ |
| Porcentaje del mundo | 0,17 % | 0,27 % |
| Puesto mundial | 51/154 | 37/154 |
Comparar el gasto militar de 2 países cualesquiera
Fuentes:
- Banco Mundial | Sector público (1960–2025, actualizado en octubre de 2026)
Creative Commons Atribución (CC BY): puedes copiar, compartir, adaptar y reutilizar este contenido, también con fines comerciales, siempre que cites a statistics.wiki e indiques los cambios que hayas hecho. Las fuentes indicadas arriba pueden tener sus propias condiciones de licencia.