
PIB por trabajador por país, 2025
| Puesto | País | PIB por trabajador (PPA) | Crecimiento real anual, 2015–2025 |
|---|---|---|---|
 Mundo |
51.458 US$ (2022) | +1,8 % (2012–2022) | |
| 1 |  Luxemburgo |
323.019 US$ | −0,6 % |
| 2 |  Irlanda |
306.231 US$ | +3,5 % |
| 3 |  Singapur |
274.424 US$ | +2,2 % |
| 4 |  Guyana |
219.984 US$ (2024) | n/d |
| 5 |  Noruega |
197.422 US$ | +0,7 % |
| 6 |  Brunéi |
191.540 US$ | n/d |
| 7 |  Suiza |
189.620 US$ | +1,1 % |
| 8 |  Estados Unidos |
183.867 US$ | +1,5 % |
| 9 |  Bélgica |
173.981 US$ | +0,4 % |
| 10 |  Catar |
171.236 US$ (2024) | −1,4 % (2014–2024) |
| 11 |  Dinamarca |
162.008 US$ | +0,9 % |
| 12 |  Países Bajos |
158.753 US$ | +0,6 % |
| 13 |  Austria |
157.863 US$ | +0,5 % |
| 14 |  Italia |
153.613 US$ | +0,2 % |
| 15 |  Arabia Saudí |
153.361 US$ | −0,5 % |
| 16 |  Alemania |
150.316 US$ | +0,5 % |
| 17 |  Francia |
149.489 US$ | +0,4 % |
| 18 |  Suecia |
147.714 US$ | +0,7 % |
| 19 |  Finlandia |
142.557 US$ | +0,2 % |
| 20 |  Islandia |
141.263 US$ | +0,9 % |
| 21 |  Australia |
137.045 US$ | +0,2 % |
| 22 |  Malta |
133.655 US$ | +1,4 % |
| 23 |  España |
133.348 US$ | −0,1 % |
| 24 |  Reino Unido |
133.311 US$ | +0,6 % |
| 25 |  Canadá |
130.590 US$ | +0,5 % |
| 26 |  Israel |
129.066 US$ | +1,3 % |
| 27 |  Eslovenia |
125.200 US$ | +1,9 % |
| 28 |  Rumanía |
125.049 US$ | +3,3 % |
| 29 |  EAU |
122.814 US$ (2024) | n/d |
| 30 |  República Checa |
121.433 US$ | +1,2 % |
| 31 |  Croacia |
118.993 US$ | +2,8 % |
| 32 |  Turquía |
115.057 US$ | +2,5 % |
| 33 |  Lituania |
113.453 US$ | +2,4 % |
| 34 |  Corea del Sur |
112.376 US$ | +1,4 % |
| 35 |  Polonia |
112.172 US$ | +3,2 % |
| 36 |  Portugal |
111.376 US$ | +0,9 % |
| 37 |  Grecia |
109.654 US$ | −0,3 % |
| 38 |  Nueva Zelanda |
104.780 US$ | +0,1 % |
| 39 |  Eslovaquia |
102.194 US$ | +1,2 % |
| 40 |  Estonia |
101.993 US$ | +0,9 % |
| 41 |  Rusia |
101.598 US$ | +1,8 % |
| 42 |  Japón |
100.933 US$ | −0,1 % |
| 43 |  Hungría |
100.493 US$ | +1,7 % |
| 44 |  Letonia |
96.534 US$ | +2,0 % |
| 45 |  Bulgaria |
95.914 US$ | +2,8 % |
| 46 |  Panamá |
95.677 US$ | +2,1 % |
| 47 |  Chipre |
86.481 US$ | +2,3 % |
| 48 |  Baréin |
85.444 US$ (2015) | −1,0 % (2005–2015) |
| 49 |  Omán |
84.081 US$ (2024) | n/d |
| 50 |  Montenegro |
80.758 US$ (2024) | +1,1 % (2014–2024) |
| 51 |  Gabón |
80.022 US$ (2024) | n/d |
| 52 |  Chile |
79.742 US$ | +0,9 % |
| 53 |  Trinidad y Tobago |
79.247 US$ (2024) | −1,2 % (2014–2024) |
| 54 |  Uruguay |
77.494 US$ | +0,8 % |
| 55 |  Costa Rica |
76.651 US$ | +3,1 % |
| 56 |  Kazajistán |
76.395 US$ (2022) | +2,0 % (2012–2022) |
| 57 |  Kuwait |
75.076 US$ (2016) | −4,2 % (2006–2016) |
| 58 |  Bahamas |
73.951 US$ (2024) | −0,1 % (2014–2024) |
| 59 |  Macedonia [...] |
73.083 US$ | +1,0 % |
| 60 |  Serbia |
72.137 US$ | +1,5 % |
| 61 |  Argentina |
71.945 US$ | n/d |
| 62 |  Malasia |
70.078 US$ (2022) | +1,6 % (2012–2022) |
| 63 |  Líbano |
69.440 US$ (2019) | −0,7 % (2009–2019) |
| 64 |  Bosnia |
67.729 US$ | +1,9 % |
| 65 |  Bielorrusia |
67.486 US$ | +1,9 % |
| 66 |  Mauricio |
67.349 US$ (2024) | +2,0 % (2014–2024) |
| 67 |  Irán |
67.322 US$ (2024) | +0,8 % (2014–2024) |
| 68 |  Egipto |
67.036 US$ (2024) | +2,2 % (2014–2024) |
| 69 |  República [...] |
63.291 US$ | +2,0 % |
| 70 |  Georgia |
62.658 US$ | +4,8 % |
| 71 |  Irak |
61.825 US$ (2021) | n/d |
| 72 |  Yibuti |
61.088 US$ | n/d |
| 73 |  Botsuana |
58.612 US$ (2024) | n/d |
| 74 |  México |
56.757 US$ | −0,6 % |
| 75 |  Sudáfrica |
55.495 US$ (2024) | −0,5 % (2014–2024) |
| 76 |  Santa Lucía |
54.968 US$ | n/d |
| 77 |  Albania |
54.785 US$ (2024) | +1,6 % (2014–2024) |
| 78 |  Mongolia |
53.822 US$ | +2,8 % |
| 79 |  Jordania |
51.640 US$ (2024) | −1,6 % (2014–2024) |
| 80 |  Argelia |
51.543 US$ (2017) | +1,1 % (2007–2017) |
| 81 |  Suazilandia |
50.635 US$ (2023) | n/d |
| 82 |  Brasil |
48.891 US$ | +0,4 % |
| 83 |  Colombia |
48.744 US$ | +1,1 % |
| 84 |  Armenia |
48.696 US$ (2023) | +4,0 % (2013–2023) |
| 85 |  Barbados |
48.565 US$ (2024) | +0,1 % (2014–2024) |
| 86 |  Maldivas |
48.513 US$ (2019) | −0,5 % (2009–2019) |
| 87 |  Túnez |
47.849 US$ (2023) | +0,4 % (2013–2023) |
| 88 |  Azerbaiyán |
47.815 US$ (2022) | +0,4 % (2012–2022) |
| 89 |  Guinea Ecuatorial |
47.566 US$ (2023) | n/d |
| 90 |  Namibia |
46.990 US$ (2023) | +1,5 % (2013–2023) |
| 91 |  Tailandia |
46.278 US$ | +1,7 % |
| 92 |  China |
44.250 US$ (2022) | +6,6 % (2012–2022) |
| 93 |  Sri Lanka |
43.304 US$ (2024) | +0,9 % (2014–2024) |
| 94 |  Paraguay |
42.010 US$ | +1,2 % |
| 95 |  Ucrania |
40.308 US$ (2021) | +0,1 % (2011–2021) |
| 96 |  Bután |
39.276 US$ | +2,0 % |
| 97 |  Fiyi |
39.191 US$ (2024) | +1,8 % (2014–2024) |
| 98 |  Surinam |
39.061 US$ (2016) | n/d |
| 99 |  Guatemala |
37.837 US$ | +1,2 % |
| 100 |  Perú |
35.337 US$ | +1,0 % |
| 101 |  Ecuador |
35.280 US$ | −0,2 % |
| 102 |  Belice |
35.057 US$ (2020) | n/d |
| 103 |  Moldavia |
34.821 US$ | +3,7 % |
| 104 |  Marruecos |
32.861 US$ (2022) | +2,2 % (2012–2022) |
| 105 |  Indonesia |
31.344 US$ (2023) | +2,6 % (2013–2023) |
| 106 |  El Salvador |
30.931 US$ | +1,0 % |
| 107 |  Vietnam |
29.639 US$ (2024) | +5,6 % (2014–2024) |
| 108 |  Palestina |
29.558 US$ (2022) | −0,9 % (2012–2022) |
| 109 |  India |
29.158 US$ | n/d |
| 110 |  Angola |
27.364 US$ | n/d |
| 111 |  Filipinas |
27.318 US$ (2024) | +2,6 % (2014–2024) |
| 112 |  Mauritania |
27.238 US$ (2019) | n/d |
| 113 |  Samoa |
27.180 US$ (2022) | +2,2 % (2012–2022) |
| 114 |  Santo Tomé |
26.659 US$ (2017) | n/d |
| 115 |  Tonga |
24.378 US$ (2023) | n/d |
| 116 |  Uzbekistán |
24.146 US$ (2020) | +4,7 % (2010–2020) |
| 117 |  Bolivia |
23.803 US$ | −2,1 % |
| 118 |  Cabo Verde |
23.696 US$ (2019) | +1,4 % (2009–2019) |
| 119 |  Bangladés |
23.635 US$ (2024) | n/d |
| 120 |  Ghana |
23.546 US$ | +3,6 % |
| 121 |  Jamaica |
23.241 US$ (2023) | −1,1 % (2013–2023) |
| 122 |  Pakistán |
21.174 US$ | +1,8 % |
| 123 |  Honduras |
20.974 US$ | +1,9 % |
| 124 |  Kirguistán |
19.750 US$ (2023) | +2,2 % (2013–2023) |
| 125 |  Laos |
19.459 US$ (2022) | n/d |
| 126 |  Nigeria |
19.353 US$ (2024) | −2,0 % (2014–2024) |
| 127 |  Senegal |
17.677 US$ | +0,3 % |
| 128 |  Zimbabue |
17.615 US$ | n/d |
| 129 |  Costa de Marfil |
17.556 US$ (2022) | +3,3 % (2012–2022) |
| 130 |  Sudán |
16.363 US$ (2022) | n/d |
| 131 |  Camboya |
15.204 US$ | +3,5 % |
| 132 |  Kenia |
14.881 US$ (2022) | n/d |
| 133 |  Nepal |
14.879 US$ (2017) | n/d |
| 134 |  Nicaragua |
13.955 US$ (2018) | +0,9 % (2008–2018) |
| 135 |  Gambia |
13.937 US$ | n/d |
| 136 |  Timor Oriental |
13.414 US$ (2022) | n/d |
| 137 |  Papúa Nueva Guinea |
13.259 US$ (2022) | n/d |
| 138 |  Camerún |
13.154 US$ (2021) | n/d |
| 139 |  Birmania |
12.942 US$ (2020) | n/d |
| 140 |  Vanuatu |
12.732 US$ | n/d |
| 141 |  Zambia |
12.348 US$ (2024) | n/d |
| 142 |  Tayikistán |
11.525 US$ (2016) | +6,0 % (2006–2016) |
| 143 |  Ruanda |
10.972 US$ | n/d |
| 144 |  Guinea |
10.737 US$ (2019) | n/d |
| 145 |  Comoras |
10.543 US$ (2021) | n/d |
| 146 |  Lesoto |
10.046 US$ (2024) | n/d |
| 147 |  Afganistán |
9962 US$ (2021) | n/d |
| 148 |  Togo |
9915 US$ (2022) | n/d |
| 149 |  Mali |
9614 US$ (2024) | +1,1 % (2014–2024) |
| 150 |  Somalia |
9266 US$ (2022) | n/d |
| 151 |  Tanzania |
9230 US$ | n/d |
| 152 |  Benín |
8855 US$ (2022) | n/d |
| 153 |  Chad |
8611 US$ (2022) | n/d |
| 154 |  Sierra Leona |
8384 US$ (2018) | n/d |
| 155 |  Burkina Faso |
8027 US$ | n/d |
| 156 |  Guinea-Bisáu |
7321 US$ (2022) | n/d |
| 157 |  Etiopía |
6587 US$ (2021) | n/d |
| 158 |  Uganda |
6343 US$ (2021) | +0,7 % (2011–2021) |
| 159 |  Malaui |
5894 US$ (2024) | n/d |
| 160 |  Níger |
4424 US$ (2022) | +1,2 % (2012–2022) |
| 161 |  Liberia |
3977 US$ (2017) | +1,5 % (2007–2017) |
| 162 |  Mozambique |
3911 US$ (2022) | n/d |
| 163 |  Madagascar |
3450 US$ (2022) | −0,3 % (2012–2022) |
| 164 |  RDC |
3229 US$ (2020) | n/d |
| 165 |  Burundi |
2295 US$ (2020) | n/d |
| Sin puesto: últimos datos anteriores a 2015 | |||
 Venezuela |
50.998 US$ (2011) | +0,9 % (2001–2011) | |
 Turkmenistán |
28.801 US$ (2010) | n/d | |
 San Vicente [...] |
27.533 US$ (2008) | n/d | |
 Yemen |
19.546 US$ (2010) | n/d | |
 Congo (Rep.) |
16.797 US$ (2012) | n/d | |
 Sudán del Sur |
7918 US$ (2008) | n/d | |
 Haití |
7769 US$ (2012) | n/d | |
 Islas Salomón |
4804 US$ (2013) | n/d | |
La lista ordena 165 países por su PIB por trabajador (PPA) más reciente: el más alto es el de Luxemburgo (323.019 dólares) y el más bajo, el de Burundi (2295 dólares, 2020). El PIB por trabajador (PPA) mundial es de 51.458 dólares (2022). La mitad de los países tiene un PIB por trabajador (PPA) inferior a 48.744 dólares.
La productividad laboral es aquí el PIB por trabajador, no por hora trabajada: el producto interior bruto de un país dividido entre el número de personas con empleo. El PIB se convierte a dólares internacionales según la paridad del poder adquisitivo (PPA), que valora los bienes y servicios de todos los países a los mismos precios, de modo que la comparación es de cuánto produce un trabajador y no de los tipos de cambio. El crecimiento real es la variación media anual del PIB por trabajador a precios constantes, sin el efecto de la subida de los precios.
Mapa de la productividad laboral: PIB por trabajador por país
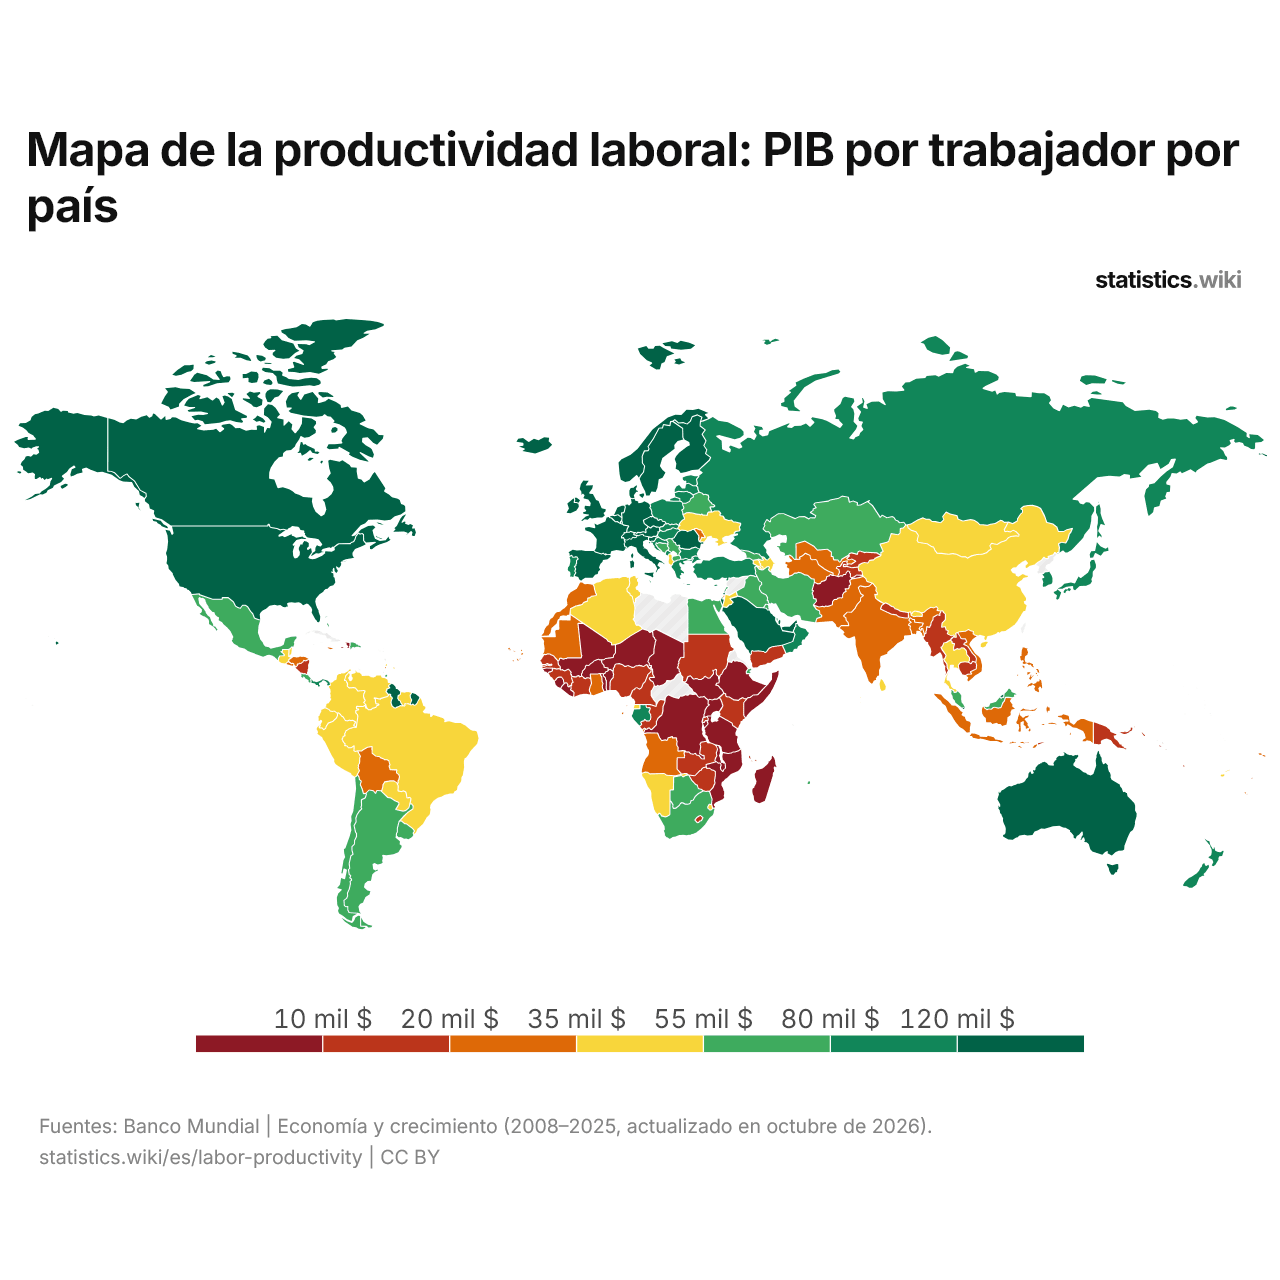
En el último año de cada país, el PIB por trabajador (PPA) no llega a 10.000 dólares en 22 países y supera los 80.000 dólares en 51.
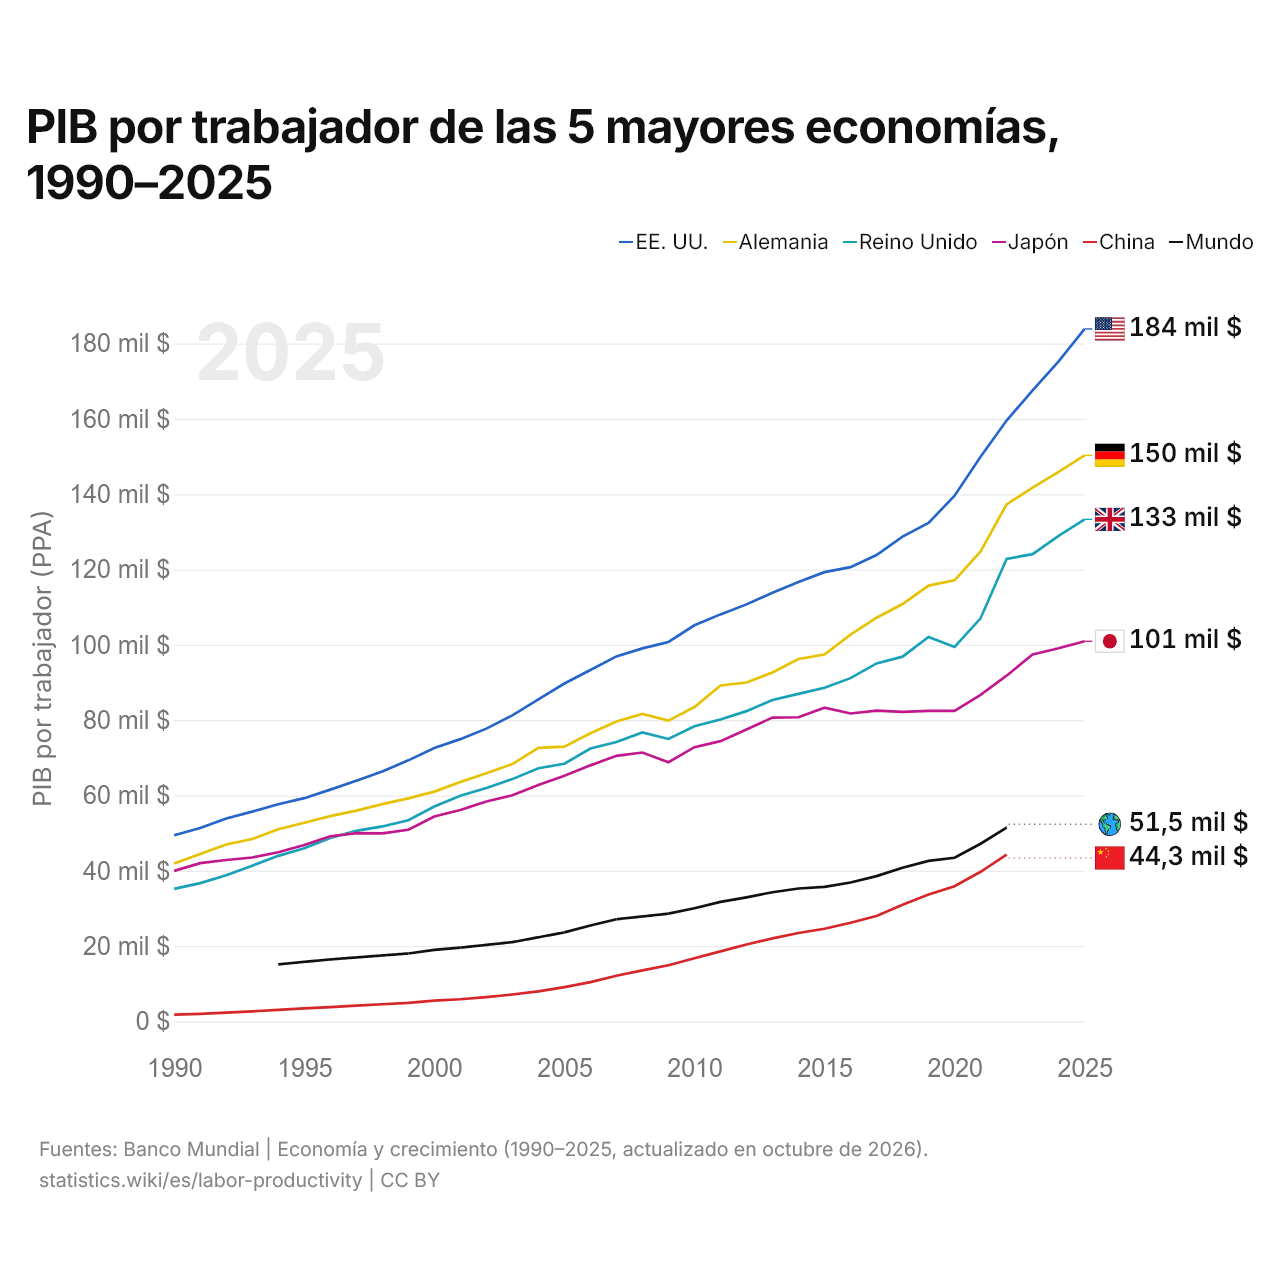
PIB por trabajador de las 5 mayores economías, 1990–2025
| Año | PIB por trabajador (PPA) | |||||
|---|---|---|---|---|---|---|
| Estados Unidos | Alemania | Reino Unido | Japón | China | Mundo | |
| 2025 | 183.867 $ | 150.316 $ | 133.311 $ | 100.933 $ | - | - |
| 2024 | 175.268 $ | 145.922 $ | 128.890 $ | 99.079 $ | - | - |
| 2023 | 167.532 $ | 141.720 $ | 124.066 $ | 97.397 $ | - | - |
| 2022 | 159.553 $ | 137.283 $ | 122.817 $ | 91.791 $ | 44.250 $ | 51.458 $ |
| 2021 | 149.935 $ | 124.802 $ | 107.012 $ | 86.719 $ | 39.713 $ | 47.165 $ |
| 2020 | 139.572 $ | 117.102 $ | 99.404 $ | 82.423 $ | 35.892 $ | 43.427 $ |
| 2019 | 132.372 $ | 115.714 $ | 102.088 $ | 82.438 $ | 33.667 $ | 42.616 $ |
| 2018 | 128.705 $ | 110.813 $ | 96.845 $ | 82.164 $ | 30.955 $ | 40.770 $ |
| 2017 | 123.825 $ | 107.190 $ | 95.045 $ | 82.495 $ | 27.975 $ | 38.565 $ |
| 2016 | 120.616 $ | 102.677 $ | 91.136 $ | 81.757 $ | 26.161 $ | 36.878 $ |
| 2015 | 119.281 $ | 97.418 $ | 88.590 $ | 83.276 $ | 24.595 $ | 35.698 $ |
| 2014 | 116.646 $ | 96.219 $ | 86.945 $ | 80.745 $ | 23.468 $ | 35.281 $ |
| 2013 | 113.811 $ | 92.639 $ | 85.330 $ | 80.662 $ | 22.038 $ | 34.289 $ |
| 2012 | 110.723 $ | 89.972 $ | 82.374 $ | 77.511 $ | 20.419 $ | 32.935 $ |
| 2011 | 108.069 $ | 89.196 $ | 80.146 $ | 74.399 $ | 18.582 $ | 31.720 $ |
| 2010 | 105.180 $ | 83.462 $ | 78.354 $ | 72.802 $ | 16.756 $ | 30.022 $ |
| 2009 | 100.753 $ | 79.846 $ | 74.985 $ | 68.811 $ | 14.889 $ | 28.592 $ |
| 2008 | 99.048 $ | 81.634 $ | 76.703 $ | 71.383 $ | 13.533 $ | - |
| 2007 | 96.914 $ | 79.610 $ | 74.171 $ | 70.498 $ | 12.116 $ | 27.115 $ |
| 2006 | 93.292 $ | 76.503 $ | 72.460 $ | 67.972 $ | 10.414 $ | 25.441 $ |
| 2005 | 89.718 $ | 72.951 $ | 68.410 $ | 65.199 $ | 9.072 $ | 23.614 $ |
| 2004 | 85.520 $ | 72.618 $ | 67.215 $ | 62.784 $ | 7.947 $ | - |
| 2003 | 81.246 $ | 68.317 $ | 64.323 $ | 60.030 $ | 7.129 $ | 21.029 $ |
| 2002 | 77.726 $ | 65.855 $ | 61.984 $ | 58.366 $ | 6.438 $ | - |
| 2001 | 74.942 $ | 63.533 $ | 59.912 $ | 56.132 $ | 5.875 $ | 19.575 $ |
| 2000 | 72.565 $ | 60.999 $ | 57.030 $ | 54.384 $ | 5.497 $ | 18.979 $ |
| 1999 | 69.308 $ | 59.213 $ | 53.413 $ | 50.880 $ | 4.905 $ | 18.021 $ |
| 1998 | 66.325 $ | 57.678 $ | 51.755 $ | 49.931 $ | 4.535 $ | - |
| 1997 | 63.874 $ | 55.957 $ | 50.571 $ | 49.991 $ | 4.174 $ | - |
| 1996 | 61.528 $ | 54.498 $ | 48.673 $ | 49.102 $ | 3.791 $ | 16.447 $ |
| 1995 | 59.268 $ | 52.739 $ | 45.977 $ | 46.849 $ | 3.421 $ | - |
| 1994 | 57.664 $ | 51.028 $ | 43.945 $ | 44.910 $ | 3.044 $ | 15.137 $ |
| 1993 | 55.697 $ | 48.430 $ | 41.332 $ | 43.518 $ | 2.660 $ | - |
| 1992 | 53.869 $ | 46.959 $ | 38.779 $ | 42.835 $ | 2.300 $ | - |
| 1991 | 51.324 $ | 44.441 $ | 36.702 $ | 42.012 $ | 1.986 $ | - |
| 1990 | 49.420 $ | 41.933 $ | 35.179 $ | 39.961 $ | 1.796 $ | - |
En 2025, el PIB por trabajador (PPA) fue de 183.867 dólares en Estados Unidos, 150.316 dólares en Alemania, 133.311 dólares en el Reino Unido, 100.933 dólares en Japón y 44.250 dólares en China (2022). El PIB por trabajador de Estados Unidos ha sido el más alto de las cinco todos los años desde 1990. El cambio más reciente en su orden fue en 1997, cuando el PIB por trabajador del Reino Unido superó al de Japón.
Comparar la productividad laboral de 2 países cualesquiera
Fuentes:
- Banco Mundial | Economía y crecimiento (1990–2025, actualizado en octubre de 2026)
Creative Commons Atribución (CC BY): puedes copiar, compartir, adaptar y reutilizar este contenido, también con fines comerciales, siempre que cites a statistics.wiki e indiques los cambios que hayas hecho. Las fuentes indicadas arriba pueden tener sus propias condiciones de licencia.