
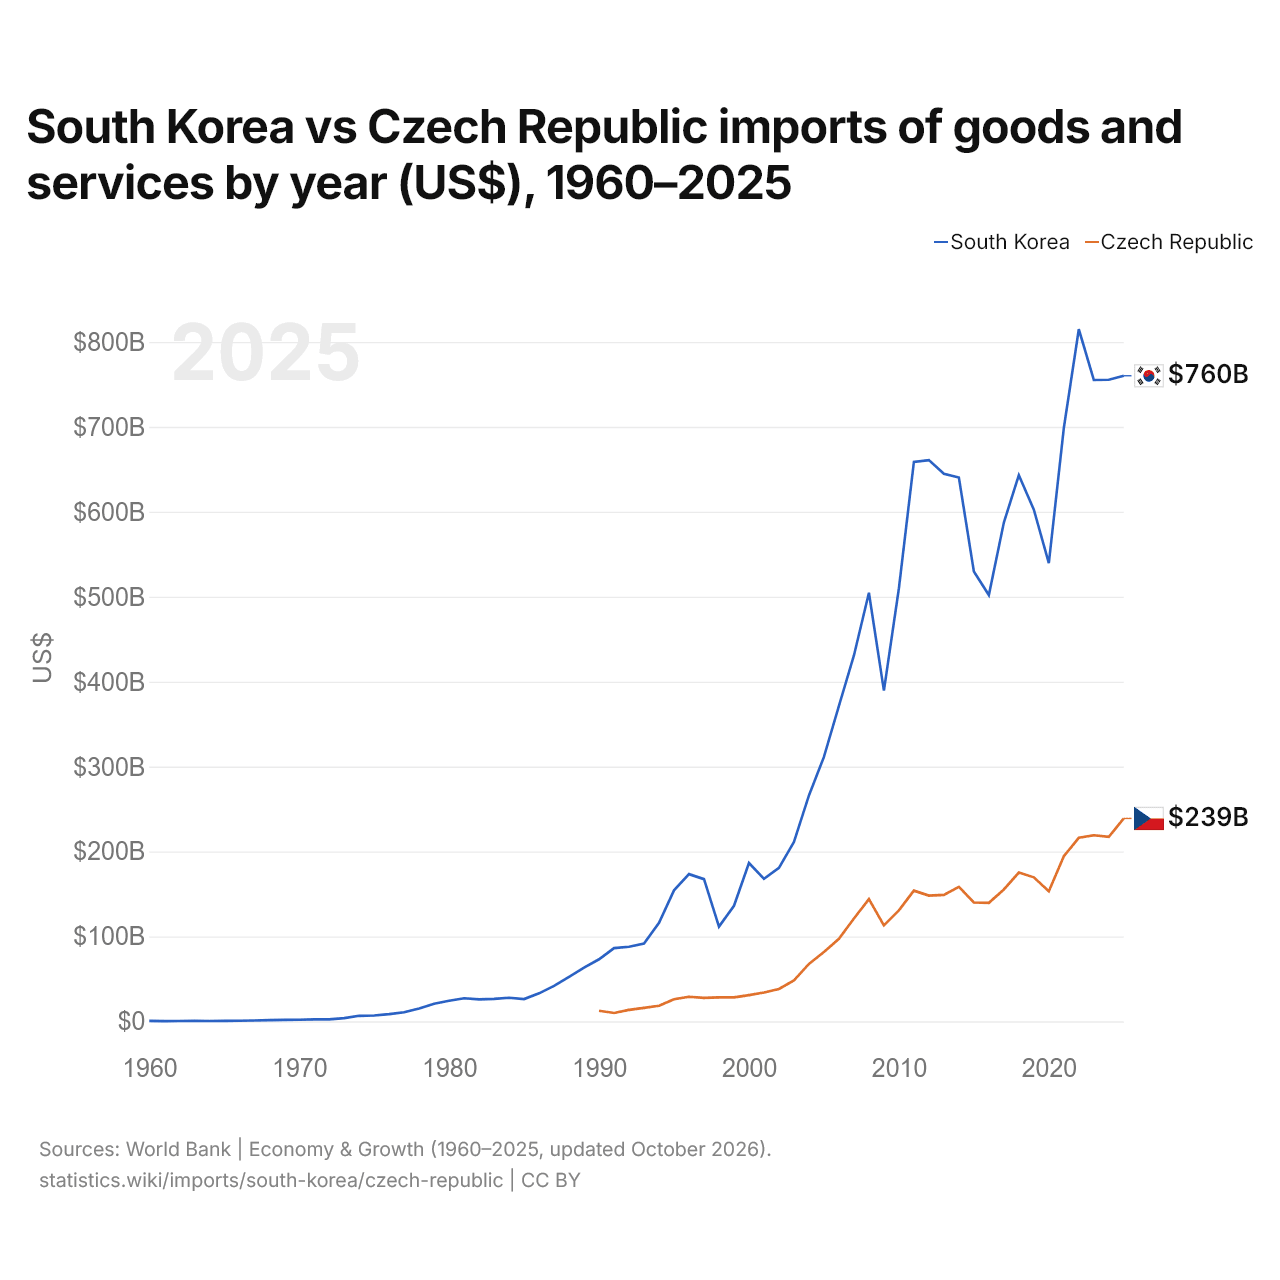
Corea del Sur vs República Checa: importaciones de bienes y servicios por año (US$), 1960–2025
| Año | US$ | |
|---|---|---|
 Corea del Sur |
 República Checa |
|
| 2025 | 760.157.311.935 US$ | 238.895.347.774 US$ |
| 2024 | 755.486.201.522 US$ | 217.301.727.913 US$ |
| 2023 | 755.197.457.230 US$ | 219.076.391.731 US$ |
| 2022 | 814.936.711.591 US$ | 216.117.395.213 US$ |
| 2021 | 698.601.348.291 US$ | 194.451.452.690 US$ |
| 2020 | 539.436.709.934 US$ | 153.225.751.554 US$ |
| 2019 | 602.460.189.255 US$ | 169.560.596.976 US$ |
| 2018 | 643.142.886.152 US$ | 175.215.168.029 US$ |
| 2017 | 587.337.161.919 US$ | 155.241.626.146 US$ |
| 2016 | 501.960.383.970 US$ | 139.581.736.162 US$ |
| 2015 | 529.797.582.127 US$ | 139.950.729.204 US$ |
| 2014 | 640.345.541.583 US$ | 158.318.631.820 US$ |
| 2013 | 644.649.663.351 US$ | 148.950.542.268 US$ |
| 2012 | 660.911.494.403 US$ | 148.043.927.979 US$ |
| 2011 | 658.770.946.515 US$ | 153.901.041.201 US$ |
| 2010 | 510.006.485.309 US$ | 130.639.247.051 US$ |
| 2009 | 389.431.370.553 US$ | 112.951.738.971 US$ |
| 2008 | 504.705.472.100 US$ | 143.962.757.078 US$ |
| 2007 | 430.767.883.126 US$ | 121.105.712.610 US$ |
| 2006 | 371.584.656.529 US$ | 97.122.758.413 US$ |
| 2005 | 311.368.128.261 US$ | 81.579.428.486 US$ |
| 2004 | 266.051.158.489 US$ | 67.612.627.336 US$ |
| 2003 | 211.120.763.751 US$ | 48.289.127.583 US$ |
| 2002 | 180.702.673.025 US$ | 38.081.836.120 US$ |
| 2001 | 167.799.772.362 US$ | 34.009.759.252 US$ |
| 2000 | 186.383.219.529 US$ | 30.886.476.403 US$ |
| 1999 | 136.054.279.857 US$ | 28.180.143.017 US$ |
| 1998 | 111.609.107.996 US$ | 28.302.510.440 US$ |
| 1997 | 167.463.480.086 US$ | 27.602.007.660 US$ |
| 1996 | 173.342.318.317 US$ | 28.952.706.187 US$ |
| 1995 | 154.227.820.411 US$ | 26.029.502.638 US$ |
| 1994 | 116.128.928.672 US$ | 18.295.180.997 US$ |
| 1993 | 91.538.648.223 US$ | 15.861.421.535 US$ |
| 1992 | 87.861.307.514 US$ | 13.453.377.892 US$ |
| 1991 | 86.243.424.554 US$ | 9.807.155.002 US$ |
| 1990 | 73.079.706.490 US$ | 12.452.629.310 US$ |
| 1989 | 63.184.948.287 US$ | - |
| 1988 | 52.389.830.154 US$ | - |
| 1987 | 41.753.533.905 US$ | - |
| 1986 | 32.919.918.017 US$ | - |
| 1985 | 26.160.433.093 US$ | - |
| 1984 | 27.795.127.347 US$ | - |
| 1983 | 26.387.424.890 US$ | - |
| 1982 | 25.783.350.263 US$ | - |
| 1981 | 27.162.601.026 US$ | - |
| 1980 | 24.291.587.954 US$ | - |
| 1979 | 20.687.809.917 US$ | - |
| 1978 | 15.192.975.207 US$ | - |
| 1977 | 10.721.900.826 US$ | - |
| 1976 | 8.480.785.124 US$ | - |
| 1975 | 6.827.892.562 US$ | - |
| 1974 | 6.511.196.682 US$ | - |
| 1973 | 3.839.358.990 US$ | - |
| 1972 | 2.330.143.840 US$ | - |
| 1971 | 2.280.298.720 US$ | - |
| 1970 | 1.902.717.644 US$ | - |
| 1969 | 1.724.037.412 US$ | - |
| 1968 | 1.385.168.718 US$ | - |
| 1967 | 955.578.713 US$ | - |
| 1966 | 715.713.825 US$ | - |
| 1965 | 447.070.730 US$ | - |
| 1964 | 428.344.230 US$ | - |
| 1963 | 584.615.385 US$ | - |
| 1962 | 439.230.769 US$ | - |
| 1961 | 337.362.180 US$ | - |
| 1960 | 473.663.366 US$ | - |
En 2025, las importaciones de bienes y servicios de Corea del Sur fueron de 760 mil millones de US$ y las de la República Checa, de 239 mil millones de US$: las de Corea del Sur fueron 3,2 veces mayores. En 1990, las importaciones de Corea del Sur fueron 5,9 veces mayores: 73,1 mil millones de US$ de Corea del Sur y 12,5 mil millones de US$ de la República Checa.
Las importaciones de bienes y servicios de Corea del Sur han sido mayores que las de la República Checa todos los años desde 1990.
Corea del Sur vs República Checa: cifras de importaciones
|
Corea del Sur
|
República Checa
|
|
|---|---|---|
| Importaciones | 760 mil M US$ (2025) | 239 mil M US$ (2025) |
| Puesto mundial | 11/174 | 33/174 |
| Porcentaje del mundo | 2,25 % | 0,71 % |
| % del PIB | 40,6 % | 61,1 % |
| Mayor categoría de bienes | Maquinaria, electrónica y vehículos (40,5 %, 2025) | Maquinaria, electrónica y vehículos (50,1 %, 2025) |
| Principal origen de bienes | China (22,5 %, 2025) | Alemania (20,2 %, 2025) |
Comparar las importaciones de 2 países cualesquiera
Fuentes:
- Banco Mundial | Economía y crecimiento (1960–2025, actualizado en octubre de 2026)
- TradeMap (2001–2025, actualizado en octubre de 2026)
Creative Commons Atribución (CC BY): puedes copiar, compartir, adaptar y reutilizar este contenido, también con fines comerciales, siempre que cites a statistics.wiki e indiques los cambios que hayas hecho. Las fuentes indicadas arriba pueden tener sus propias condiciones de licencia.