
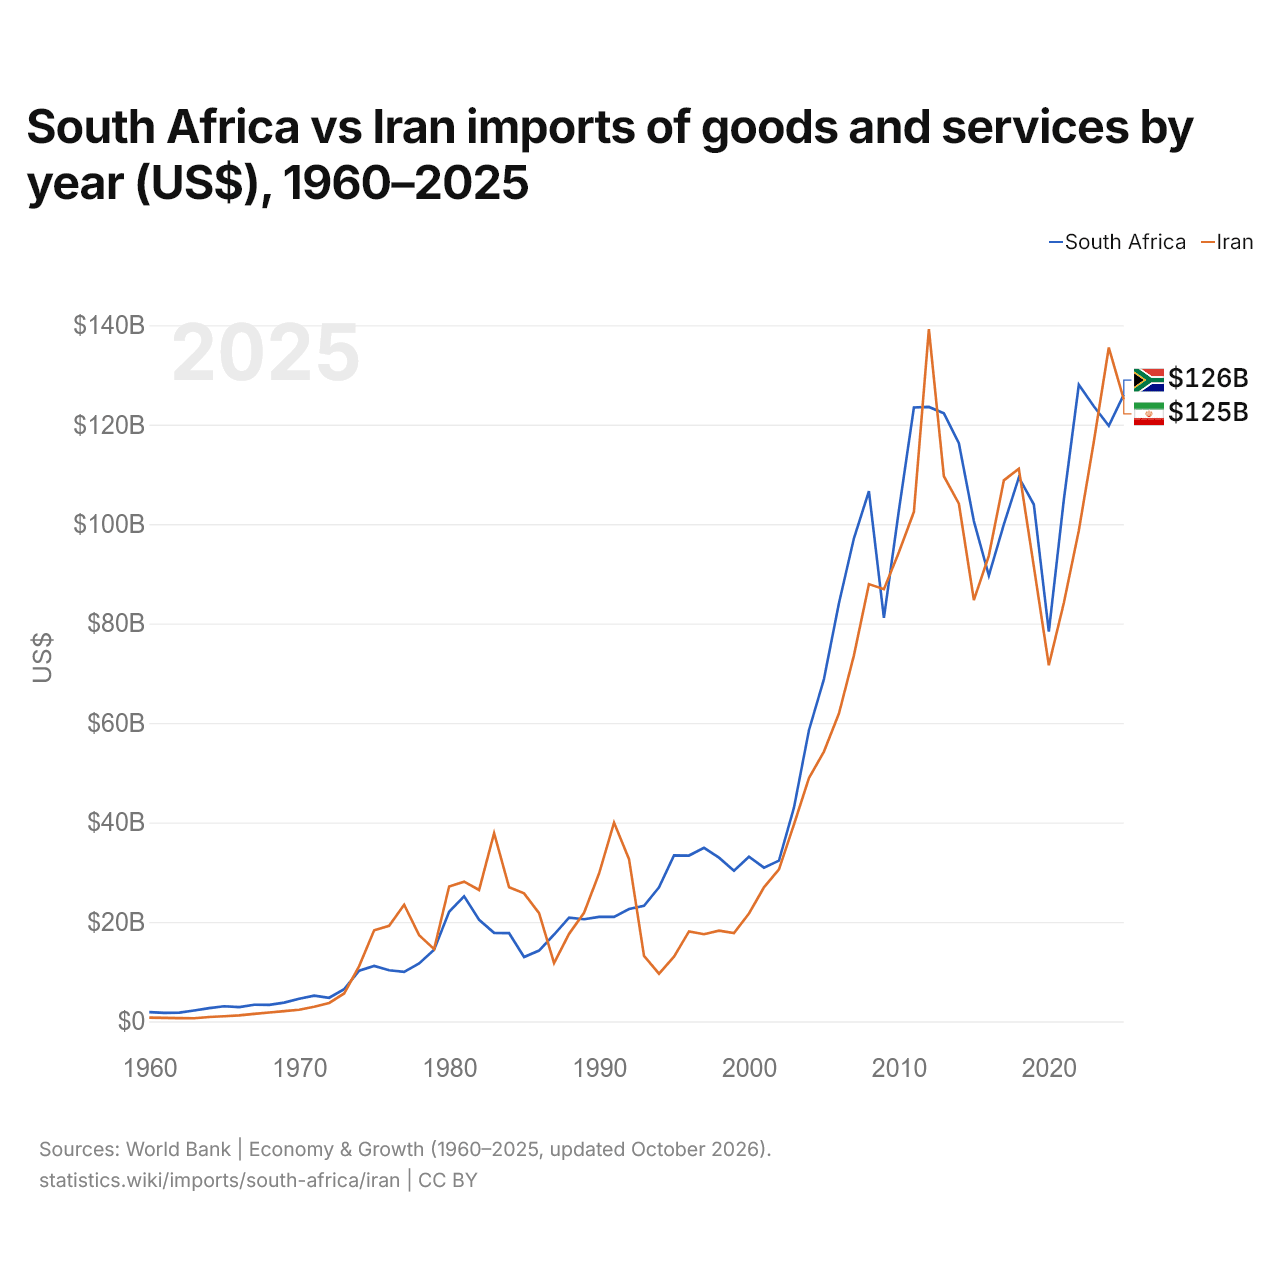
Sudáfrica vs Irán: importaciones de bienes y servicios por año (US$), 1960–2025
1x
| Año | US$ | |
|---|---|---|
 Sudáfrica |
 Irán |
|
| 2025 | 126.023.231.105 US$ | 125.082.704.286 US$ |
| 2024 | 119.761.291.334 US$ | 135.497.500.556 US$ |
| 2023 | 123.686.210.464 US$ | 116.536.624.174 US$ |
| 2022 | 128.016.518.313 US$ | 98.698.959.865 US$ |
| 2021 | 104.883.607.898 US$ | 84.130.836.516 US$ |
| 2020 | 78.355.182.004 US$ | 71.621.658.126 US$ |
| 2019 | 103.935.027.605 US$ | 91.441.131.367 US$ |
| 2018 | 109.373.822.795 US$ | 111.113.616.112 US$ |
| 2017 | 99.923.782.384 US$ | 108.797.238.836 US$ |
| 2016 | 89.649.913.399 US$ | 93.653.399.160 US$ |
| 2015 | 100.591.042.327 US$ | 84.709.856.958 US$ |
| 2014 | 116.261.670.807 US$ | 104.109.992.191 US$ |
| 2013 | 122.253.185.706 US$ | 109.606.636.051 US$ |
| 2012 | 123.558.580.031 US$ | 139.198.634.095 US$ |
| 2011 | 123.430.705.323 US$ | 102.452.976.011 US$ |
| 2010 | 102.766.114.851 US$ | 94.350.200.000 US$ |
| 2009 | 81.135.290.312 US$ | 86.903.100.000 US$ |
| 2008 | 106.598.986.615 US$ | 87.923.600.000 US$ |
| 2007 | 97.145.854.047 US$ | 73.597.500.000 US$ |
| 2006 | 84.077.365.460 US$ | 61.880.856.748 US$ |
| 2005 | 68.831.329.348 US$ | 54.239.627.796 US$ |
| 2004 | 58.544.113.474 US$ | 48.904.300.000 US$ |
| 2003 | 42.967.056.805 US$ | 39.575.353.988 US$ |
| 2002 | 32.316.210.606 US$ | 30.560.192.008 US$ |
| 2001 | 30.897.364.105 US$ | 26.939.208.541 US$ |
| 2000 | 33.107.016.485 US$ | 21.688.407.084 US$ |
| 1999 | 30.286.845.829 US$ | 17.752.833.900 US$ |
| 1998 | 32.916.543.361 US$ | 18.245.137.477 US$ |
| 1997 | 34.878.325.820 US$ | 17.511.229.164 US$ |
| 1996 | 33.339.931.231 US$ | 18.092.098.185 US$ |
| 1995 | 33.385.762.947 US$ | 12.985.745.384 US$ |
| 1994 | 26.964.924.504 US$ | 9.571.397.629 US$ |
| 1993 | 23.232.862.325 US$ | 13.150.789.257 US$ |
| 1992 | 22.581.586.205 US$ | 32.617.010.800 US$ |
| 1991 | 21.011.728.108 US$ | 39.978.163.184 US$ |
| 1990 | 21.016.333.111 US$ | 29.707.835.778 US$ |
| 1989 | 20.522.923.715 US$ | 21.819.187.476 US$ |
| 1988 | 20.846.125.831 US$ | 17.595.820.159 US$ |
| 1987 | 17.453.548.150 US$ | 11.695.655.291 US$ |
| 1986 | 14.231.748.177 US$ | 21.773.514.754 US$ |
| 1985 | 12.921.130.268 US$ | 25.746.070.825 US$ |
| 1984 | 17.732.941.000 US$ | 26.971.526.132 US$ |
| 1983 | 17.786.554.169 US$ | 37.834.565.739 US$ |
| 1982 | 20.405.851.452 US$ | 26.415.543.503 US$ |
| 1981 | 25.138.477.562 US$ | 28.082.907.606 US$ |
| 1980 | 22.027.800.533 US$ | 27.125.991.305 US$ |
| 1979 | 14.412.907.961 US$ | 14.516.475.277 US$ |
| 1978 | 11.625.352.906 US$ | 17.330.359.279 US$ |
| 1977 | 9.939.452.485 US$ | 23.448.812.229 US$ |
| 1976 | 10.274.102.569 US$ | 19.212.061.650 US$ |
| 1975 | 11.142.543.421 US$ | 18.318.369.218 US$ |
| 1974 | 10.199.020.717 US$ | 11.105.780.994 US$ |
| 1973 | 6.474.445.897 US$ | 5.594.486.012 US$ |
| 1972 | 4.735.113.337 US$ | 3.689.022.456 US$ |
| 1971 | 5.155.078.808 US$ | 2.928.005.748 US$ |
| 1970 | 4.537.398.185 US$ | 2.327.125.277 US$ |
| 1969 | 3.770.198.492 US$ | 2.050.926.065 US$ |
| 1968 | 3.310.998.676 US$ | 1.768.850.274 US$ |
| 1967 | 3.337.598.665 US$ | 1.485.305.338 US$ |
| 1966 | 2.858.798.856 US$ | 1.195.883.823 US$ |
| 1965 | 3.035.198.786 US$ | 1.021.055.598 US$ |
| 1964 | 2.647.398.941 US$ | 878.548.558 US$ |
| 1963 | 2.185.399.126 US$ | 614.102.504 US$ |
| 1962 | 1.755.599.298 US$ | 642.016.254 US$ |
| 1961 | 1.698.199.321 US$ | 702.251.188 US$ |
| 1960 | 1.860.599.256 US$ | 730.164.939 US$ |
En 2025, las importaciones de bienes y servicios de Sudáfrica fueron de 126 mil millones de US$ y las de Irán, de 125 mil millones de US$: las de Sudáfrica fueron un 0,75 % mayores. En 1960, las importaciones de Sudáfrica fueron 2,5 veces mayores: 1,86 mil millones de US$ de Sudáfrica y 730 millones de US$ de Irán.
Sudáfrica vs Irán: cifras de importaciones
|
Sudáfrica
|
Irán
|
|
|---|---|---|
| Importaciones | 126 mil M US$ (2025) | 125 mil M US$ (2025) |
| Puesto mundial | 43/174 | 44/174 |
| Porcentaje del mundo | 0,37 % | 0,37 % |
| % del PIB | 29,5 % | 34,5 % |
| Mayor categoría de bienes | Maquinaria, electrónica y vehículos (35,4 %, 2025) | Maquinaria, electrónica y vehículos (33,4 %, 2023) |
| Principal origen de bienes | China (22,4 %, 2025) | Emiratos Árabes Unidos (31,4 %, 2023) |
Comparar las importaciones de 2 países cualesquiera
Fuentes:
- Banco Mundial | Economía y crecimiento (1960–2025, actualizado en octubre de 2026)
- TradeMap (2001–2025, actualizado en octubre de 2026)
Creative Commons Atribución (CC BY): puedes copiar, compartir, adaptar y reutilizar este contenido, también con fines comerciales, siempre que cites a statistics.wiki e indiques los cambios que hayas hecho. Las fuentes indicadas arriba pueden tener sus propias condiciones de licencia.