
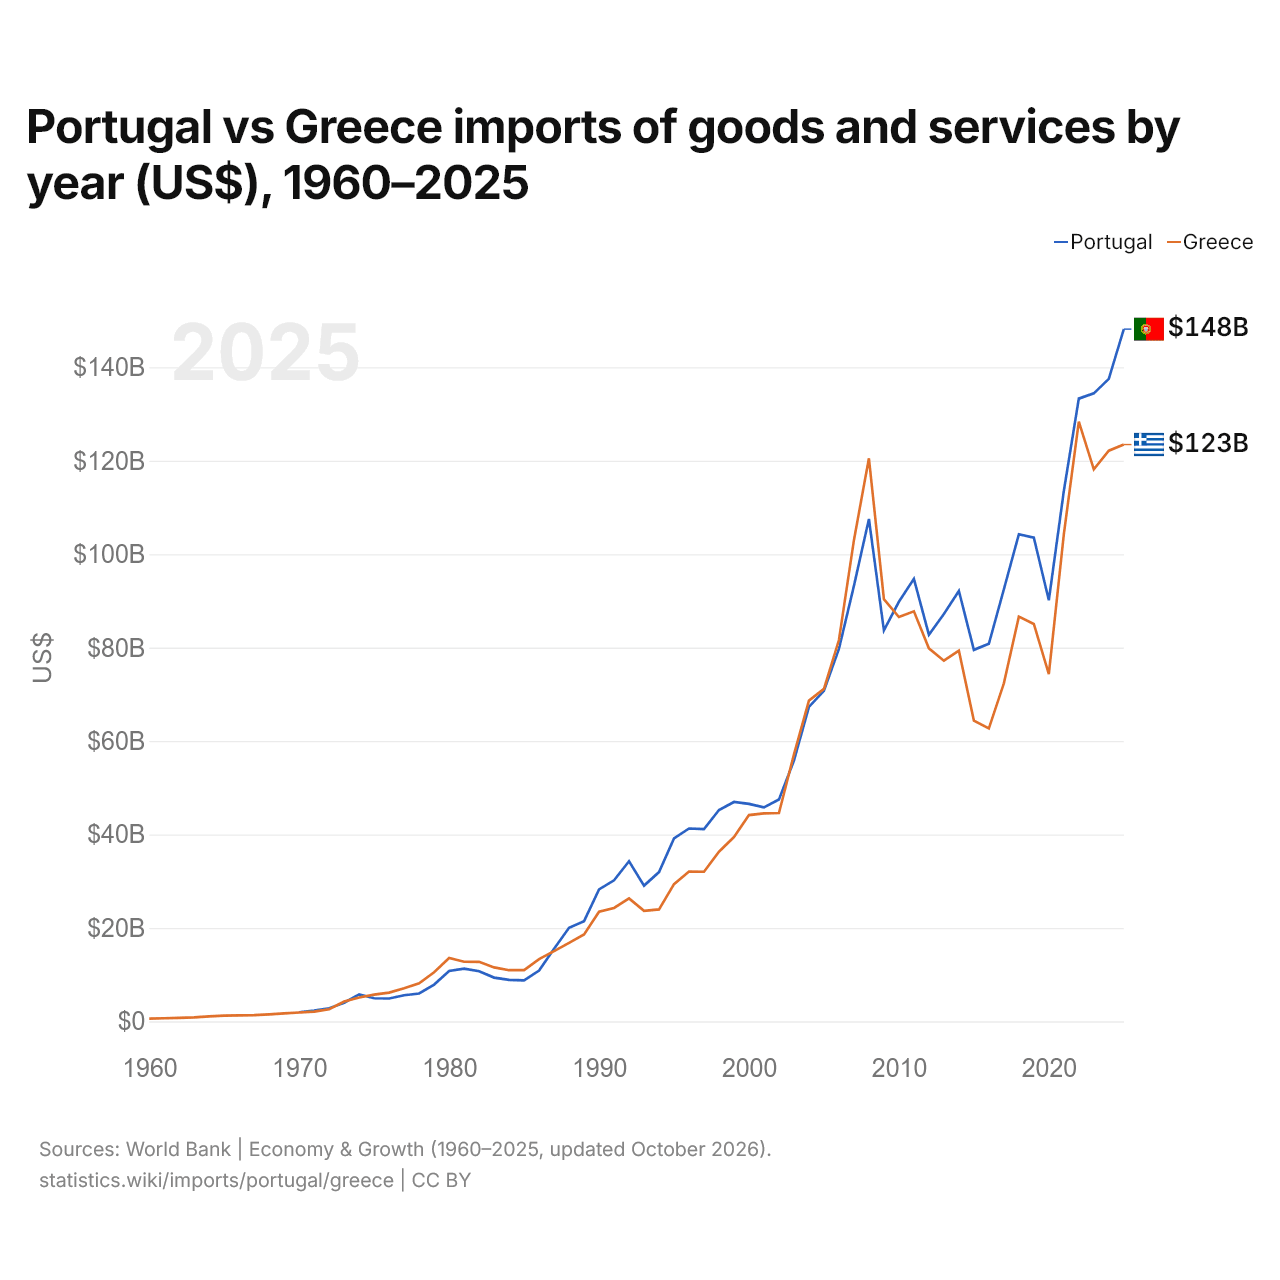
Portugal vs Grecia: importaciones de bienes y servicios por año (US$), 1960–2025
| Año | US$ | |
|---|---|---|
 Portugal |
 Grecia |
|
| 2025 | 148.156.593.238 US$ | 123.451.154.938 US$ |
| 2024 | 137.513.069.104 US$ | 122.135.634.583 US$ |
| 2023 | 134.411.585.081 US$ | 118.150.196.971 US$ |
| 2022 | 133.285.364.419 US$ | 128.374.908.057 US$ |
| 2021 | 113.497.070.631 US$ | 104.244.992.302 US$ |
| 2020 | 90.131.397.408 US$ | 74.331.725.301 US$ |
| 2019 | 103.532.874.929 US$ | 85.057.106.801 US$ |
| 2018 | 104.240.636.748 US$ | 86.614.659.222 US$ |
| 2017 | 92.464.542.115 US$ | 72.343.865.240 US$ |
| 2016 | 80.804.179.611 US$ | 62.714.485.982 US$ |
| 2015 | 79.509.937.177 US$ | 64.373.172.350 US$ |
| 2014 | 92.113.305.018 US$ | 79.339.278.432 US$ |
| 2013 | 87.194.990.738 US$ | 77.182.468.214 US$ |
| 2012 | 82.755.123.140 US$ | 79.840.747.061 US$ |
| 2011 | 94.725.068.832 US$ | 87.759.343.351 US$ |
| 2010 | 89.801.905.968 US$ | 86.535.244.649 US$ |
| 2009 | 83.673.807.857 US$ | 90.361.949.970 US$ |
| 2008 | 107.512.515.975 US$ | 120.506.590.536 US$ |
| 2007 | 93.196.905.901 US$ | 102.995.736.171 US$ |
| 2006 | 79.723.354.569 US$ | 81.609.358.172 US$ |
| 2005 | 70.735.904.961 US$ | 71.151.157.412 US$ |
| 2004 | 67.301.751.547 US$ | 68.651.660.463 US$ |
| 2003 | 55.799.780.174 US$ | 57.150.848.327 US$ |
| 2002 | 47.495.078.930 US$ | 44.580.655.233 US$ |
| 2001 | 45.789.575.479 US$ | 44.498.203.088 US$ |
| 2000 | 46.550.613.708 US$ | 44.143.578.731 US$ |
| 1999 | 46.950.345.046 US$ | 39.439.145.913 US$ |
| 1998 | 45.239.506.901 US$ | 36.304.887.582 US$ |
| 1997 | 41.132.256.146 US$ | 32.010.861.101 US$ |
| 1996 | 41.278.931.635 US$ | 32.073.925.538 US$ |
| 1995 | 39.151.232.586 US$ | 29.364.836.005 US$ |
| 1994 | 31.944.022.947 US$ | 23.950.542.135 US$ |
| 1993 | 29.049.311.807 US$ | 23.647.201.249 US$ |
| 1992 | 34.266.584.497 US$ | 26.320.284.233 US$ |
| 1991 | 30.177.947.829 US$ | 24.257.674.332 US$ |
| 1990 | 28.247.582.618 US$ | 23.470.174.119 US$ |
| 1989 | 21.452.554.113 US$ | 18.598.323.542 US$ |
| 1988 | 20.038.610.028 US$ | 16.804.861.878 US$ |
| 1987 | 15.532.868.934 US$ | 15.023.311.525 US$ |
| 1986 | 10.858.608.766 US$ | 13.308.325.219 US$ |
| 1985 | 8.751.378.986 US$ | 10.969.930.915 US$ |
| 1984 | 8.884.931.526 US$ | 10.944.470.979 US$ |
| 1983 | 9.363.968.512 US$ | 11.546.946.594 US$ |
| 1982 | 10.708.695.762 US$ | 12.729.729.592 US$ |
| 1981 | 11.270.547.231 US$ | 12.749.102.091 US$ |
| 1980 | 10.783.476.171 US$ | 13.578.081.535 US$ |
| 1979 | 7.863.475.410 US$ | 10.490.505.980 US$ |
| 1978 | 5.958.549.270 US$ | 8.158.051.948 US$ |
| 1977 | 5.594.295.443 US$ | 7.076.234.968 US$ |
| 1976 | 4.891.100.796 US$ | 6.137.434.701 US$ |
| 1975 | 4.943.349.020 US$ | 5.714.686.504 US$ |
| 1974 | 5.759.928.966 US$ | 5.097.863.636 US$ |
| 1973 | 3.968.323.794 US$ | 4.246.950.518 US$ |
| 1972 | 2.797.946.627 US$ | 2.585.238.636 US$ |
| 1971 | 2.302.600.707 US$ | 2.092.545.455 US$ |
| 1970 | 1.954.344.491 US$ | 1.892.363.636 US$ |
| 1969 | - | 1.713.711.188 US$ |
| 1968 | - | 1.493.529.905 US$ |
| 1967 | - | 1.335.955.753 US$ |
| 1966 | - | 1.269.316.414 US$ |
| 1965 | - | 1.237.694.816 US$ |
| 1964 | - | 1.054.609.848 US$ |
| 1963 | - | 851.556.932 US$ |
| 1962 | - | 727.671.595 US$ |
| 1961 | - | 662.633.781 US$ |
| 1960 | - | 597.402.875 US$ |
En 2025, las importaciones de bienes y servicios de Portugal fueron de 148 mil millones de US$ y las de Grecia, de 123 mil millones de US$: las de Portugal fueron un 20 % mayores. En 1970, las importaciones de Portugal fueron un 3,3 % mayores: 1,95 mil millones de US$ de Portugal y 1,89 mil millones de US$ de Grecia.
Las importaciones de bienes y servicios de Portugal han sido mayores que las de Grecia todos los años desde 2010.
Portugal vs Grecia: cifras de importaciones
|
Portugal
|
Grecia
|
|
|---|---|---|
| Importaciones | 148 mil M US$ (2025) | 123 mil M US$ (2025) |
| Puesto mundial | 40/174 | 45/174 |
| Porcentaje del mundo | 0,44 % | 0,37 % |
| % del PIB | 42,7 % | 44,0 % |
| Mayor categoría de bienes | Maquinaria, electrónica y vehículos (34 %, 2025) | Maquinaria, electrónica y vehículos (26,3 %, 2025) |
| Principal origen de bienes | España (32,8 %, 2025) | Alemania (11,5 %, 2025) |
Comparar las importaciones de 2 países cualesquiera
Fuentes:
- Banco Mundial | Economía y crecimiento (1960–2025, actualizado en octubre de 2026)
- TradeMap (2001–2025, actualizado en octubre de 2026)
Creative Commons Atribución (CC BY): puedes copiar, compartir, adaptar y reutilizar este contenido, también con fines comerciales, siempre que cites a statistics.wiki e indiques los cambios que hayas hecho. Las fuentes indicadas arriba pueden tener sus propias condiciones de licencia.