
Perú vs Malasia: importaciones de bienes y servicios por año (US$), 1960–2025
| Año | US$ | |
|---|---|---|
 Perú |
 Malasia |
|
| 2025 | 73.151.196.614 US$ | 308.949.499.863 US$ |
| 2024 | 66.511.219.153 US$ | 278.760.544.031 US$ |
| 2023 | 63.620.745.195 US$ | 255.625.703.550 US$ |
| 2022 | 70.042.848.043 US$ | 283.918.591.272 US$ |
| 2021 | 59.278.649.389 US$ | 236.990.392.678 US$ |
| 2020 | 42.768.390.082 US$ | 186.310.380.061 US$ |
| 2019 | 52.301.323.566 US$ | 210.893.037.729 US$ |
| 2018 | 52.175.148.626 US$ | 221.902.484.183 US$ |
| 2017 | 48.096.481.263 US$ | 201.496.430.250 US$ |
| 2016 | 43.730.752.205 US$ | 181.125.866.049 US$ |
| 2015 | 45.316.302.181 US$ | 186.603.344.673 US$ |
| 2014 | 48.682.936.932 US$ | 218.115.959.742 US$ |
| 2013 | 50.251.323.236 US$ | 216.892.331.705 US$ |
| 2012 | 48.490.551.588 US$ | 215.525.053.249 US$ |
| 2011 | 43.774.372.753 US$ | 207.619.404.295 US$ |
| 2010 | 35.180.390.248 US$ | 181.099.423.890 US$ |
| 2009 | 26.182.192.418 US$ | 143.890.358.442 US$ |
| 2008 | 34.605.420.554 US$ | 178.114.431.987 US$ |
| 2007 | 24.690.635.986 US$ | 167.027.920.021 US$ |
| 2006 | 18.835.277.591 US$ | 147.060.242.731 US$ |
| 2005 | 15.598.932.266 US$ | 130.552.677.358 US$ |
| 2004 | 12.701.974.339 US$ | 118.513.157.895 US$ |
| 2003 | 10.929.811.451 US$ | 96.153.421.053 US$ |
| 2002 | 9.845.922.051 US$ | 91.820.789.474 US$ |
| 2001 | 9.606.339.614 US$ | 86.253.947.368 US$ |
| 2000 | 9.712.312.674 US$ | 94.349.736.842 US$ |
| 1999 | 8.937.804.698 US$ | 76.187.894.737 US$ |
| 1998 | 10.684.099.133 US$ | 67.655.931.512 US$ |
| 1997 | 11.043.543.544 US$ | 92.380.580.595 US$ |
| 1996 | 10.132.013.201 US$ | 90.962.318.149 US$ |
| 1995 | 9.770.813.015 US$ | 86.952.551.834 US$ |
| 1994 | 7.249.134.948 US$ | 67.592.211.553 US$ |
| 1993 | 5.683.170.881 US$ | 52.860.519.911 US$ |
| 1992 | 5.561.752.159 US$ | 44.155.181.215 US$ |
| 1991 | 4.964.700.219 US$ | 40.044.733.779 US$ |
| 1990 | 3.637.366.699 US$ | 31.883.543.602 US$ |
| 1989 | 2.521.553.466 US$ | 25.372.465.430 US$ |
| 1988 | 2.797.976.000 US$ | 19.826.003.147 US$ |
| 1987 | 5.417.433.054 US$ | 15.776.869.534 US$ |
| 1986 | 3.950.815.558 US$ | 13.922.838.476 US$ |
| 1985 | 2.824.798.399 US$ | 15.529.741.341 US$ |
| 1984 | 3.057.815.383 US$ | 17.772.765.636 US$ |
| 1983 | 3.729.505.450 US$ | 17.142.918.686 US$ |
| 1982 | 4.849.715.099 US$ | 15.971.622.751 US$ |
| 1981 | 4.918.094.895 US$ | 14.633.320.675 US$ |
| 1980 | 4.012.390.289 US$ | 13.478.905.389 US$ |
| 1979 | 2.964.592.488 US$ | 9.999.808.083 US$ |
| 1978 | 2.439.416.948 US$ | 7.114.292.401 US$ |
| 1977 | 3.217.196.370 US$ | 5.601.956.378 US$ |
| 1976 | 3.176.349.370 US$ | 4.571.968.169 US$ |
| 1975 | 3.616.472.288 US$ | 4.193.454.364 US$ |
| 1974 | 2.958.656.331 US$ | 4.565.307.073 US$ |
| 1973 | 1.687.338.580 US$ | 2.747.070.596 US$ |
| 1972 | 1.322.997.436 US$ | 1.884.339.236 US$ |
| 1971 | 1.224.806.241 US$ | 1.656.477.495 US$ |
| 1970 | 1.157.622.719 US$ | 1.596.749.009 US$ |
| 1969 | 1.080.103.339 US$ | 1.356.648.656 US$ |
| 1968 | 1.082.687.378 US$ | 1.322.348.606 US$ |
| 1967 | 1.249.655.603 US$ | 1.228.595.135 US$ |
| 1966 | 1.170.768.069 US$ | 1.212.261.778 US$ |
| 1965 | 980.611.456 US$ | 1.194.948.419 US$ |
| 1964 | 818.467.051 US$ | 1.132.554.994 US$ |
| 1963 | 776.482.909 US$ | 1.104.134.953 US$ |
| 1962 | 721.234.799 US$ | 863.381.266 US$ |
| 1961 | 643.328.376 US$ | 790.861.160 US$ |
| 1960 | 521.357.001 US$ | 752.314.437 US$ |
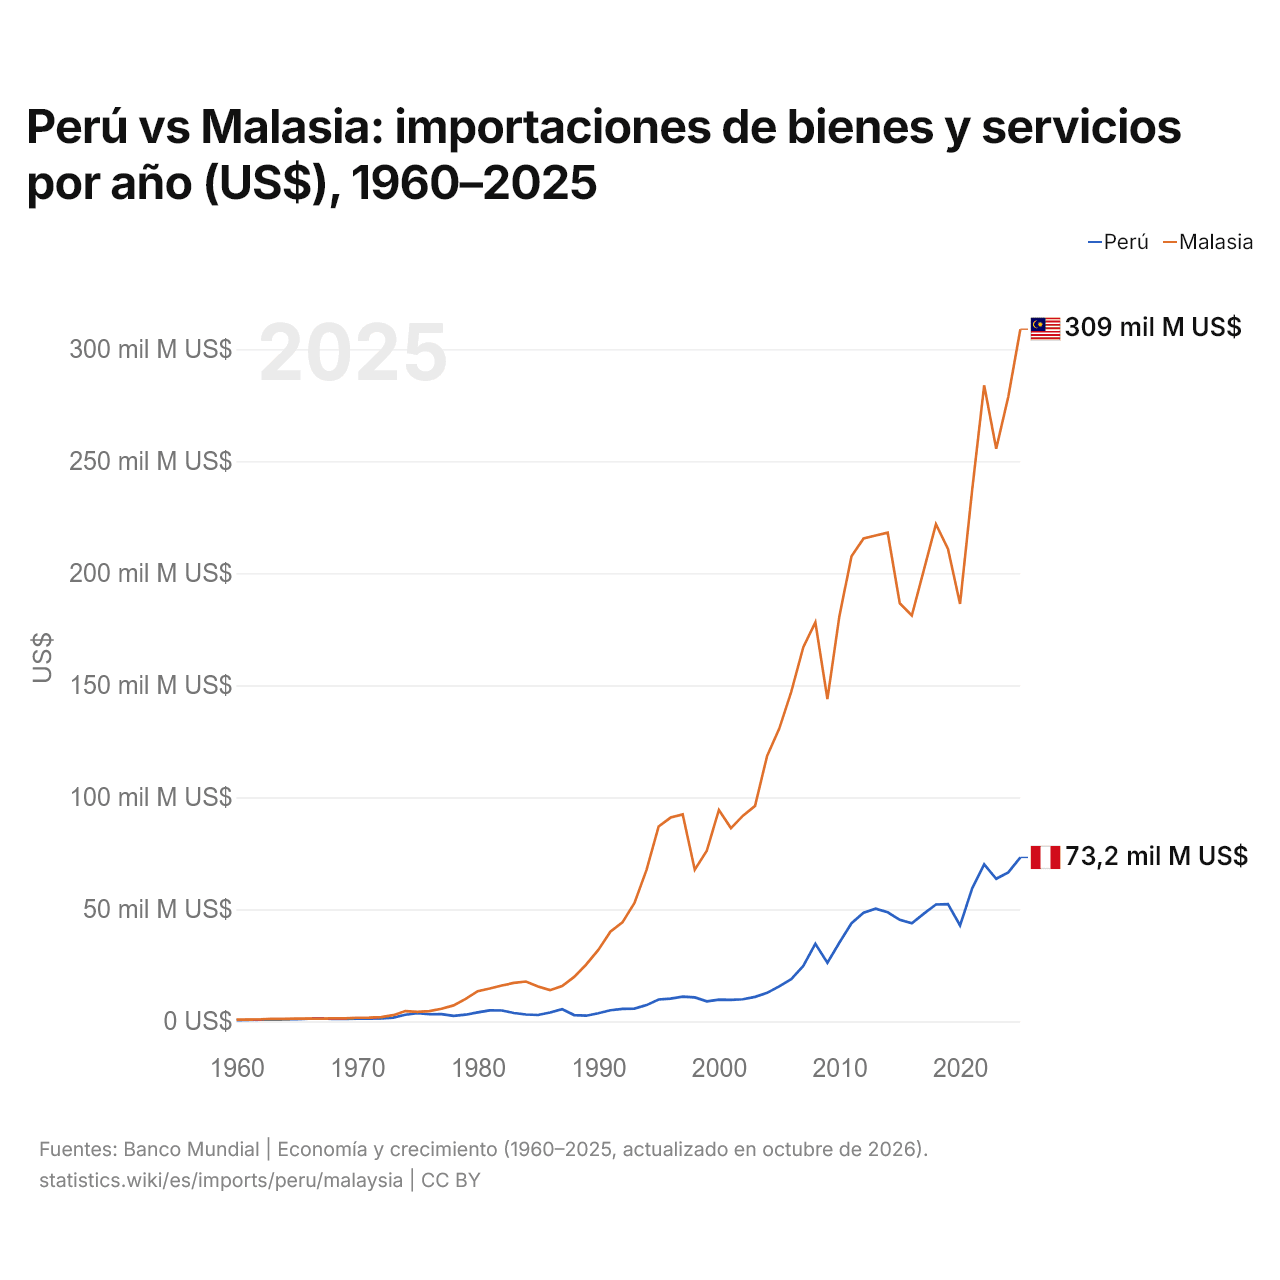
En 2025, las importaciones de bienes y servicios de Perú fueron de 73,2 mil millones de US$ y las de Malasia, de 309 mil millones de US$: las de Malasia fueron 4,2 veces mayores. En 1960, las importaciones de Malasia fueron un 44 % mayores: 521 millones de US$ de Perú y 752 millones de US$ de Malasia.
Las importaciones de bienes y servicios de Malasia han sido mayores que las de Perú todos los años desde 1968.
Perú vs Malasia: cifras de importaciones
|
Perú
|
Malasia
|
|
|---|---|---|
| Importaciones | 73,2 mil M US$ (2025) | 309 mil M US$ (2025) |
| Puesto mundial | 55/174 | 29/174 |
| Porcentaje del mundo | 0,22 % | 0,92 % |
| % del PIB | 21,8 % | 65,4 % |
| Mayor categoría de bienes | Maquinaria, electrónica y vehículos (34,7 %, 2025) | Maquinaria, electrónica y vehículos (54,4 %, 2025) |
| Principal origen de bienes | China (31,2 %, 2025) | China (24,3 %, 2025) |
Comparar las importaciones de 2 países cualesquiera
Fuentes:
- Banco Mundial | Economía y crecimiento (1960–2025, actualizado en octubre de 2026)
- TradeMap (2001–2025, actualizado en octubre de 2026)
Creative Commons Atribución (CC BY): puedes copiar, compartir, adaptar y reutilizar este contenido, también con fines comerciales, siempre que cites a statistics.wiki e indiques los cambios que hayas hecho. Las fuentes indicadas arriba pueden tener sus propias condiciones de licencia.