
Papúa Nueva Guinea vs Nueva Zelanda: importaciones de bienes y servicios por año (US$), 1961–2025
| Año | US$ | |
|---|---|---|
 Papúa Nueva Guinea |
 Nueva Zelanda |
|
| 2025 | - | 68.437.598.569 US$ |
| 2024 | - | 67.872.925.251 US$ |
| 2023 | - | 67.259.738.399 US$ |
| 2022 | - | 72.824.127.400 US$ |
| 2021 | - | 66.218.701.372 US$ |
| 2020 | - | 47.267.342.891 US$ |
| 2019 | - | 57.834.143.128 US$ |
| 2018 | - | 59.288.362.519 US$ |
| 2017 | - | 55.121.884.788 US$ |
| 2016 | - | 48.848.436.331 US$ |
| 2015 | - | 47.973.639.708 US$ |
| 2014 | - | 54.700.660.896 US$ |
| 2013 | - | 51.933.398.299 US$ |
| 2012 | - | 49.626.355.944 US$ |
| 2011 | - | 48.544.383.578 US$ |
| 2010 | - | 40.992.659.831 US$ |
| 2009 | - | 32.056.967.956 US$ |
| 2008 | - | 43.041.400.155 US$ |
| 2007 | - | 39.993.385.757 US$ |
| 2006 | - | 33.455.677.323 US$ |
| 2005 | - | 34.110.399.211 US$ |
| 2004 | 2.313.836.701 US$ | 30.398.655.462 US$ |
| 2003 | 1.910.762.304 US$ | 24.776.474.899 US$ |
| 2002 | 1.739.815.379 US$ | 19.861.008.428 US$ |
| 2001 | 1.609.847.465 US$ | 17.132.931.525 US$ |
| 2000 | 1.734.030.165 US$ | 17.245.422.211 US$ |
| 1999 | 1.838.951.201 US$ | 17.893.507.707 US$ |
| 1998 | 1.849.984.946 US$ | 15.900.310.543 US$ |
| 1997 | 2.470.798.271 US$ | 17.791.716.573 US$ |
| 1996 | 2.495.111.002 US$ | 18.774.802.276 US$ |
| 1995 | 2.026.003.218 US$ | 17.590.993.624 US$ |
| 1994 | 2.188.351.144 US$ | 15.508.272.788 US$ |
| 1993 | 1.837.898.712 US$ | 12.606.603.617 US$ |
| 1992 | 2.000.829.359 US$ | 11.679.604.424 US$ |
| 1991 | 1.975.315.126 US$ | 10.889.038.938 US$ |
| 1990 | 1.575.952.825 US$ | 11.758.799.976 US$ |
| 1989 | 1.870.639.977 US$ | 11.255.844.233 US$ |
| 1988 | 1.898.384.528 US$ | 10.034.138.486 US$ |
| 1987 | 1.561.627.340 US$ | 9.643.454.039 US$ |
| 1986 | 1.359.873.236 US$ | 7.997.993.240 US$ |
| 1985 | 1.270.800.968 US$ | 7.759.079.284 US$ |
| 1984 | 1.356.627.218 US$ | 7.450.482.215 US$ |
| 1983 | 1.369.617.268 US$ | 7.191.771.819 US$ |
| 1982 | 1.432.986.033 US$ | 7.420.247.633 US$ |
| 1981 | 1.467.531.246 US$ | 7.557.239.197 US$ |
| 1980 | 1.357.486.445 US$ | 6.947.500.483 US$ |
| 1979 | 1.045.722.065 US$ | 6.256.636.282 US$ |
| 1978 | 884.719.822 US$ | 4.799.331.104 US$ |
| 1977 | 759.153.307 US$ | 4.286.560.679 US$ |
| 1976 | 616.543.497 US$ | 3.980.904.131 US$ |
| 1975 | 626.265.720 US$ | 3.862.660.944 US$ |
| 1974 | 584.641.851 US$ | 4.590.457.805 US$ |
| 1973 | 452.341.666 US$ | 3.054.125.504 US$ |
| 1972 | 414.352.024 US$ | 2.047.885.270 US$ |
| 1971 | 418.007.993 US$ | 1.716.099.250 US$ |
| 1970 | 348.208.056 US$ | 1.628.844.215 US$ |
| 1969 | 253.008.040 US$ | - |
| 1968 | 194.432.031 US$ | - |
| 1967 | 175.056.028 US$ | - |
| 1966 | 156.912.025 US$ | - |
| 1965 | 130.704.021 US$ | - |
| 1964 | 104.720.017 US$ | - |
| 1963 | 85.456.014 US$ | - |
| 1962 | 72.912.012 US$ | - |
| 1961 | 68.880.011 US$ | - |
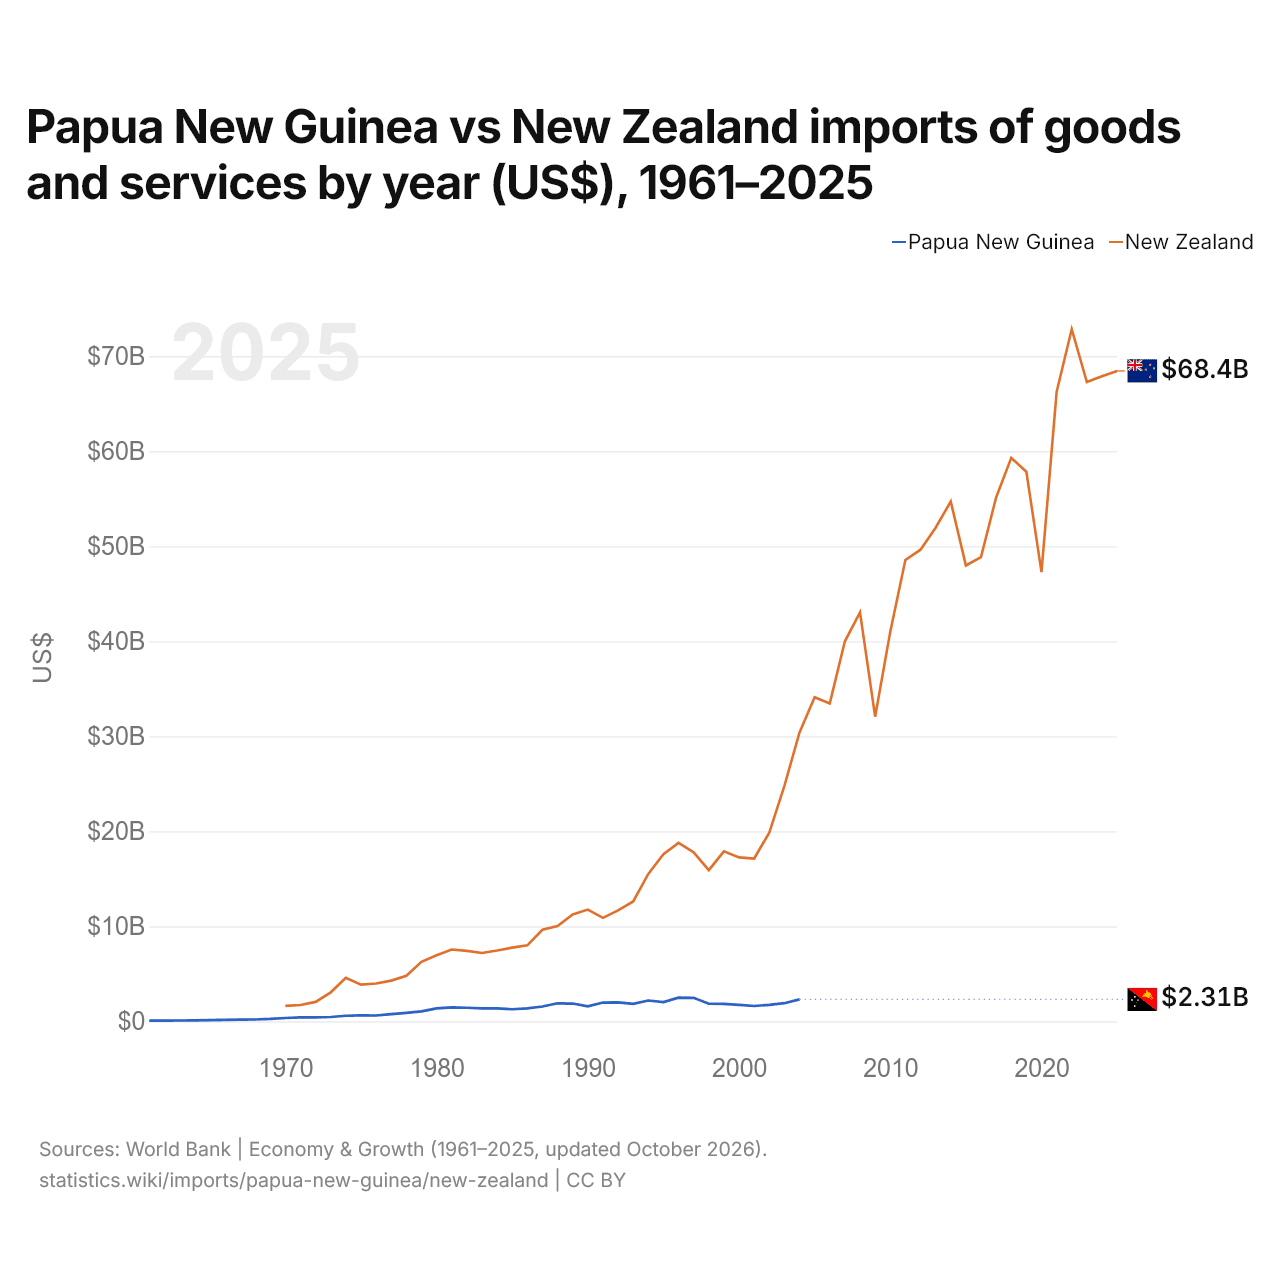
Las importaciones de bienes y servicios de Papúa Nueva Guinea son de 2,31 mil millones de US$ (2004), y las de Nueva Zelanda, de 68,4 mil millones de US$ (2025). En 1970, las importaciones de Nueva Zelanda fueron 4,7 veces mayores: 348 millones de US$ de Papúa Nueva Guinea y 1,63 mil millones de US$ de Nueva Zelanda.
Las importaciones de bienes y servicios de Nueva Zelanda han sido mayores que las de Papúa Nueva Guinea todos los años desde 1970.
Papúa Nueva Guinea vs Nueva Zelanda: cifras de importaciones
|
Papúa Nueva Guinea
|
Nueva Zelanda
|
|
|---|---|---|
| Importaciones | 2310 M US$ (2004) | 68,4 mil M US$ (2025) |
| Puesto mundial | n/d | 57/174 |
| Porcentaje del mundo | 0,02 % | 0,2 % |
| % del PIB | 58,9 % | 25,9 % |
| Mayor categoría de bienes | Maquinaria, electrónica y vehículos (36,1 %, 2024) | Maquinaria, electrónica y vehículos (41,5 %, 2025) |
| Principal origen de bienes | Australia (33,4 %, 2024) | China (22,3 %, 2025) |
Comparar las importaciones de 2 países cualesquiera
Fuentes:
- Banco Mundial | Economía y crecimiento (1961–2025, actualizado en octubre de 2026)
- TradeMap (2001–2025, actualizado en octubre de 2026)
Creative Commons Atribución (CC BY): puedes copiar, compartir, adaptar y reutilizar este contenido, también con fines comerciales, siempre que cites a statistics.wiki e indiques los cambios que hayas hecho. Las fuentes indicadas arriba pueden tener sus propias condiciones de licencia.