
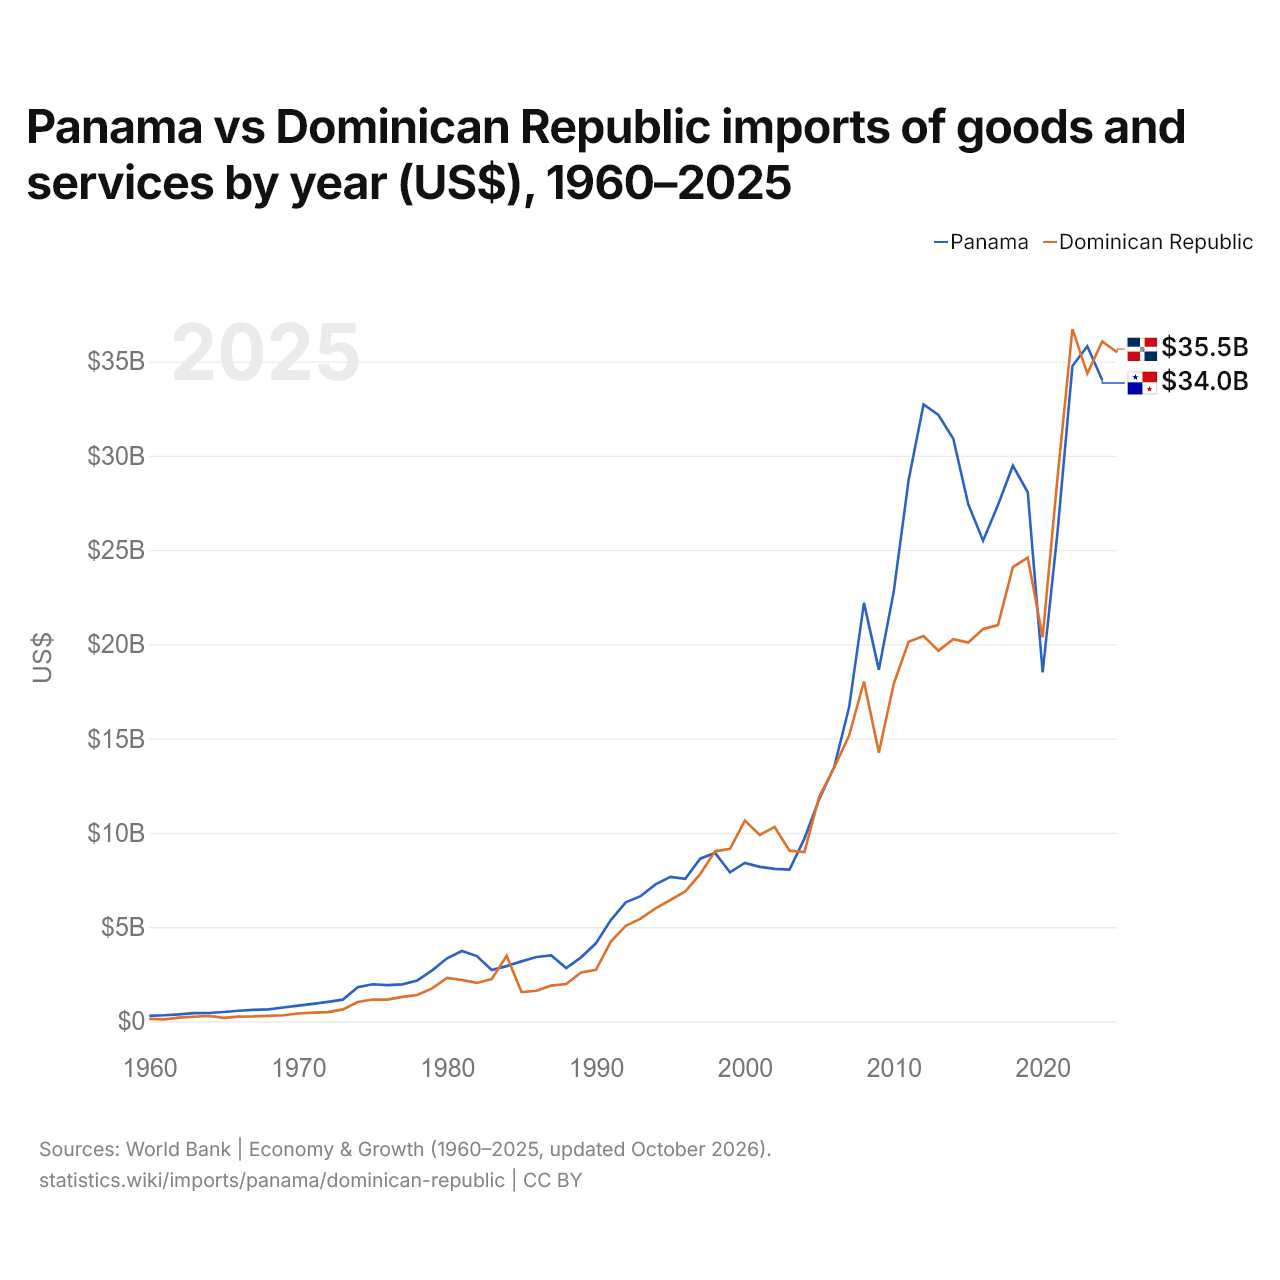
Panamá vs República Dominicana: importaciones de bienes y servicios por año (US$), 1960–2025
1x
| Año | US$ | |
|---|---|---|
 Panamá |
 República [...] |
|
| 2025 | - | 35.489.329.537 US$ |
| 2024 | 34.017.704.900 US$ | 36.061.223.105 US$ |
| 2023 | 35.804.273.200 US$ | 34.354.476.733 US$ |
| 2022 | 34.758.827.500 US$ | 36.712.448.617 US$ |
| 2021 | 25.965.646.100 US$ | 28.855.223.090 US$ |
| 2020 | 18.505.270.200 US$ | 20.371.828.907 US$ |
| 2019 | 28.061.255.700 US$ | 24.593.322.194 US$ |
| 2018 | 29.473.747.500 US$ | 24.089.276.070 US$ |
| 2017 | 27.388.495.500 US$ | 21.016.707.908 US$ |
| 2016 | 25.491.123.600 US$ | 20.804.844.203 US$ |
| 2015 | 27.433.598.900 US$ | 20.090.901.342 US$ |
| 2014 | 30.898.187.800 US$ | 20.273.979.988 US$ |
| 2013 | 32.165.330.900 US$ | 19.661.135.224 US$ |
| 2012 | 32.720.763.400 US$ | 20.433.273.135 US$ |
| 2011 | 28.715.326.100 US$ | 20.132.557.520 US$ |
| 2010 | 22.801.278.400 US$ | 17.906.216.037 US$ |
| 2009 | 18.642.684.400 US$ | 14.253.867.214 US$ |
| 2008 | 22.194.340.800 US$ | 18.024.743.516 US$ |
| 2007 | 16.654.324.300 US$ | 15.153.678.844 US$ |
| 2006 | 13.486.936.400 US$ | 13.463.084.949 US$ |
| 2005 | 11.798.912.400 US$ | 11.921.949.246 US$ |
| 2004 | 9.692.055.300 US$ | 8.974.480.635 US$ |
| 2003 | 8.044.255.200 US$ | 9.052.791.965 US$ |
| 2002 | 8.089.552.400 US$ | 10.312.030.141 US$ |
| 2001 | 8.195.266.400 US$ | 9.887.410.923 US$ |
| 2000 | 8.405.006.400 US$ | 10.646.556.077 US$ |
| 1999 | 7.902.775.100 US$ | 9.147.200.120 US$ |
| 1998 | 8.934.147.100 US$ | 9.015.949.074 US$ |
| 1997 | 8.629.854.000 US$ | 7.808.997.352 US$ |
| 1996 | 7.558.309.100 US$ | 6.887.267.086 US$ |
| 1995 | 7.664.630.500 US$ | 6.433.877.234 US$ |
| 1994 | 7.264.372.200 US$ | 5.996.926.316 US$ |
| 1993 | 6.641.440.500 US$ | 5.443.488.000 US$ |
| 1992 | 6.315.044.100 US$ | 5.067.032.000 US$ |
| 1991 | 5.369.275.600 US$ | 4.225.814.432 US$ |
| 1990 | 4.137.057.400 US$ | 2.729.569.106 US$ |
| 1989 | 3.393.593.400 US$ | 2.594.465.300 US$ |
| 1988 | 2.824.846.900 US$ | 1.981.547.781 US$ |
| 1987 | 3.497.613.100 US$ | 1.895.596.550 US$ |
| 1986 | 3.413.764.500 US$ | 1.621.540.299 US$ |
| 1985 | 3.180.313.400 US$ | 1.555.450.606 US$ |
| 1984 | 2.929.064.300 US$ | 3.479.368.010 US$ |
| 1983 | 2.724.782.300 US$ | 2.246.418.800 US$ |
| 1982 | 3.460.434.900 US$ | 2.036.678.800 US$ |
| 1981 | 3.730.569.700 US$ | 2.192.903.500 US$ |
| 1980 | 3.343.857.700 US$ | 2.303.519.820 US$ |
| 1979 | 2.701.126.300 US$ | 1.746.830.300 US$ |
| 1978 | 2.167.125.500 US$ | 1.395.042.000 US$ |
| 1977 | 1.963.649.700 US$ | 1.297.114.920 US$ |
| 1976 | 1.920.906.000 US$ | 1.152.879.210 US$ |
| 1975 | 1.968.574.100 US$ | 1.160.205.950 US$ |
| 1974 | 1.806.463.200 US$ | 1.023.192.000 US$ |
| 1973 | 1.152.110.300 US$ | 632.490.400 US$ |
| 1972 | 1.030.379.300 US$ | 489.759.560 US$ |
| 1971 | 925.391.300 US$ | 461.715.440 US$ |
| 1970 | 832.024.900 US$ | 414.895.190 US$ |
| 1969 | 731.327.800 US$ | 321.300.000 US$ |
| 1968 | 630.826.500 US$ | 287.500.000 US$ |
| 1967 | 603.791.100 US$ | 258.800.000 US$ |
| 1966 | 560.299.300 US$ | 249.300.000 US$ |
| 1965 | 496.433.000 US$ | 180.000.000 US$ |
| 1964 | 441.970.400 US$ | 287.500.000 US$ |
| 1963 | 434.329.900 US$ | 244.400.000 US$ |
| 1962 | 372.814.600 US$ | 199.300.000 US$ |
| 1961 | 321.486.400 US$ | 106.900.000 US$ |
| 1960 | 292.100.100 US$ | 126.500.000 US$ |
Las importaciones de bienes y servicios de Panamá fueron de 34 mil millones de US$ (2024) y las de la República Dominicana, de 36,1 mil millones de US$ (2024): las de la República Dominicana fueron un 6 % mayores. En 1960, las importaciones de Panamá fueron 2,3 veces mayores: 292 millones de US$ de Panamá y 127 millones de US$ de la República Dominicana.
Panamá vs República Dominicana: cifras de importaciones
|
Panamá
|
República [...]
|
|
|---|---|---|
| Importaciones | 34,0 mil M US$ (2024) | 35,5 mil M US$ (2025) |
| Puesto mundial | 77/174 | 74/174 |
| Porcentaje del mundo | 0,11 % | 0,11 % |
| % del PIB | 39,3 % | 27,9 % |
| Mayor categoría de bienes | Maquinaria, electrónica y vehículos (30,2 %, 2025) | Maquinaria, electrónica y vehículos (25,2 %, 2025) |
| Principal origen de bienes | China (26,9 %, 2025) | Estados Unidos (40,1 %, 2025) |
Comparar las importaciones de 2 países cualesquiera
Fuentes:
- Banco Mundial | Economía y crecimiento (1960–2025, actualizado en octubre de 2026)
- TradeMap (2001–2025, actualizado en octubre de 2026)
Creative Commons Atribución (CC BY): puedes copiar, compartir, adaptar y reutilizar este contenido, también con fines comerciales, siempre que cites a statistics.wiki e indiques los cambios que hayas hecho. Las fuentes indicadas arriba pueden tener sus propias condiciones de licencia.