
Omán vs México: importaciones de bienes y servicios por año (US$), 1960–2025
1x
| Año | US$ | |
|---|---|---|
 Omán |
 México |
|
| 2025 | 53.205.941.136 US$ | 738.162.519.127 US$ |
| 2024 | 52.261.638.492 US$ | 698.190.455.616 US$ |
| 2023 | 47.632.509.753 US$ | 674.539.332.149 US$ |
| 2022 | 46.681.404.421 US$ | 672.827.146.644 US$ |
| 2021 | 37.217.165.150 US$ | 559.543.398.298 US$ |
| 2020 | 34.023.407.022 US$ | 421.735.413.259 US$ |
| 2019 | 32.569.570.871 US$ | 507.718.819.550 US$ |
| 2018 | 35.373.211.964 US$ | 517.202.845.543 US$ |
| 2017 | 34.959.687.906 US$ | 469.597.181.246 US$ |
| 2016 | 31.211.963.589 US$ | 432.376.614.132 US$ |
| 2015 | 36.777.633.290 US$ | 439.821.695.268 US$ |
| 2014 | 37.856.957.087 US$ | 445.312.781.391 US$ |
| 2013 | 41.830.949.285 US$ | 423.928.383.607 US$ |
| 2012 | 34.397.919.376 US$ | 410.653.072.131 US$ |
| 2011 | 29.235.370.611 US$ | 389.836.031.336 US$ |
| 2010 | 24.236.671.001 US$ | 334.456.322.123 US$ |
| 2009 | 21.537.061.118 US$ | 264.902.814.265 US$ |
| 2008 | 26.587.776.333 US$ | 340.860.425.741 US$ |
| 2007 | 19.440.832.250 US$ | 313.922.896.029 US$ |
| 2006 | 13.778.933.680 US$ | 284.933.176.454 US$ |
| 2005 | 11.172.951.886 US$ | 248.437.817.057 US$ |
| 2004 | 11.024.707.412 US$ | 220.739.895.660 US$ |
| 2003 | 8.657.997.399 US$ | 191.730.637.234 US$ |
| 2002 | 7.513.654.096 US$ | 189.355.937.339 US$ |
| 2001 | 7.209.362.809 US$ | 184.678.218.802 US$ |
| 2000 | 6.351.105.332 US$ | 190.555.678.047 US$ |
| 1999 | 6.013.003.901 US$ | 155.258.243.956 US$ |
| 1998 | 7.003.901.170 US$ | 138.306.850.713 US$ |
| 1997 | 4.993.498.049 US$ | 121.630.321.174 US$ |
| 1996 | 4.468.140.442 US$ | 99.589.465.577 US$ |
| 1995 | 4.010.403.121 US$ | 79.072.391.842 US$ |
| 1994 | 3.672.301.691 US$ | 90.814.853.233 US$ |
| 1993 | 3.882.964.889 US$ | 77.229.254.751 US$ |
| 1992 | 3.615.084.525 US$ | 73.709.242.760 US$ |
| 1991 | 3.219.765.930 US$ | 60.602.372.094 US$ |
| 1990 | 2.634.590.377 US$ | 51.768.004.611 US$ |
| 1989 | - | 42.503.750.803 US$ |
| 1988 | 2.629.388.817 US$ | 33.950.898.441 US$ |
| 1987 | 2.270.480.884 US$ | 18.775.902.765 US$ |
| 1986 | 2.997.523.182 US$ | 17.390.079.327 US$ |
| 1985 | 3.720.377.828 US$ | 19.065.246.504 US$ |
| 1984 | 3.315.025.608 US$ | 16.774.715.780 US$ |
| 1983 | 3.019.687.319 US$ | 14.025.463.387 US$ |
| 1982 | 3.259.988.419 US$ | 17.919.648.239 US$ |
| 1981 | 2.764.910.539 US$ | 32.330.287.579 US$ |
| 1980 | 2.252.461.204 US$ | 25.269.530.739 US$ |
| 1979 | 1.519.976.549 US$ | 16.750.506.468 US$ |
| 1978 | 1.335.263.173 US$ | 11.332.164.976 US$ |
| 1977 | 1.207.295.599 US$ | 8.373.206.929 US$ |
| 1976 | 1.176.896.642 US$ | 8.769.603.267 US$ |
| 1975 | 1.062.826.288 US$ | 8.465.680.000 US$ |
| 1974 | 786.045.165 US$ | 7.612.160.000 US$ |
| 1973 | 266.627.884 US$ | 5.232.144.000 US$ |
| 1972 | 160.511.552 US$ | 3.991.120.000 US$ |
| 1971 | 96.727.623 US$ | 3.417.960.000 US$ |
| 1970 | 50.399.960 US$ | 3.430.408.000 US$ |
| 1969 | 28.559.977 US$ | 3.011.216.000 US$ |
| 1968 | 27.839.978 US$ | 2.746.232.000 US$ |
| 1967 | 24.026.313 US$ | 2.392.912.000 US$ |
| 1966 | - | 2.192.168.000 US$ |
| 1965 | - | 2.079.752.000 US$ |
| 1964 | - | 1.978.568.000 US$ |
| 1963 | - | 1.688.128.000 US$ |
| 1962 | - | 1.536.528.000 US$ |
| 1961 | - | 1.503.120.000 US$ |
| 1960 | - | 1.520.944.000 US$ |
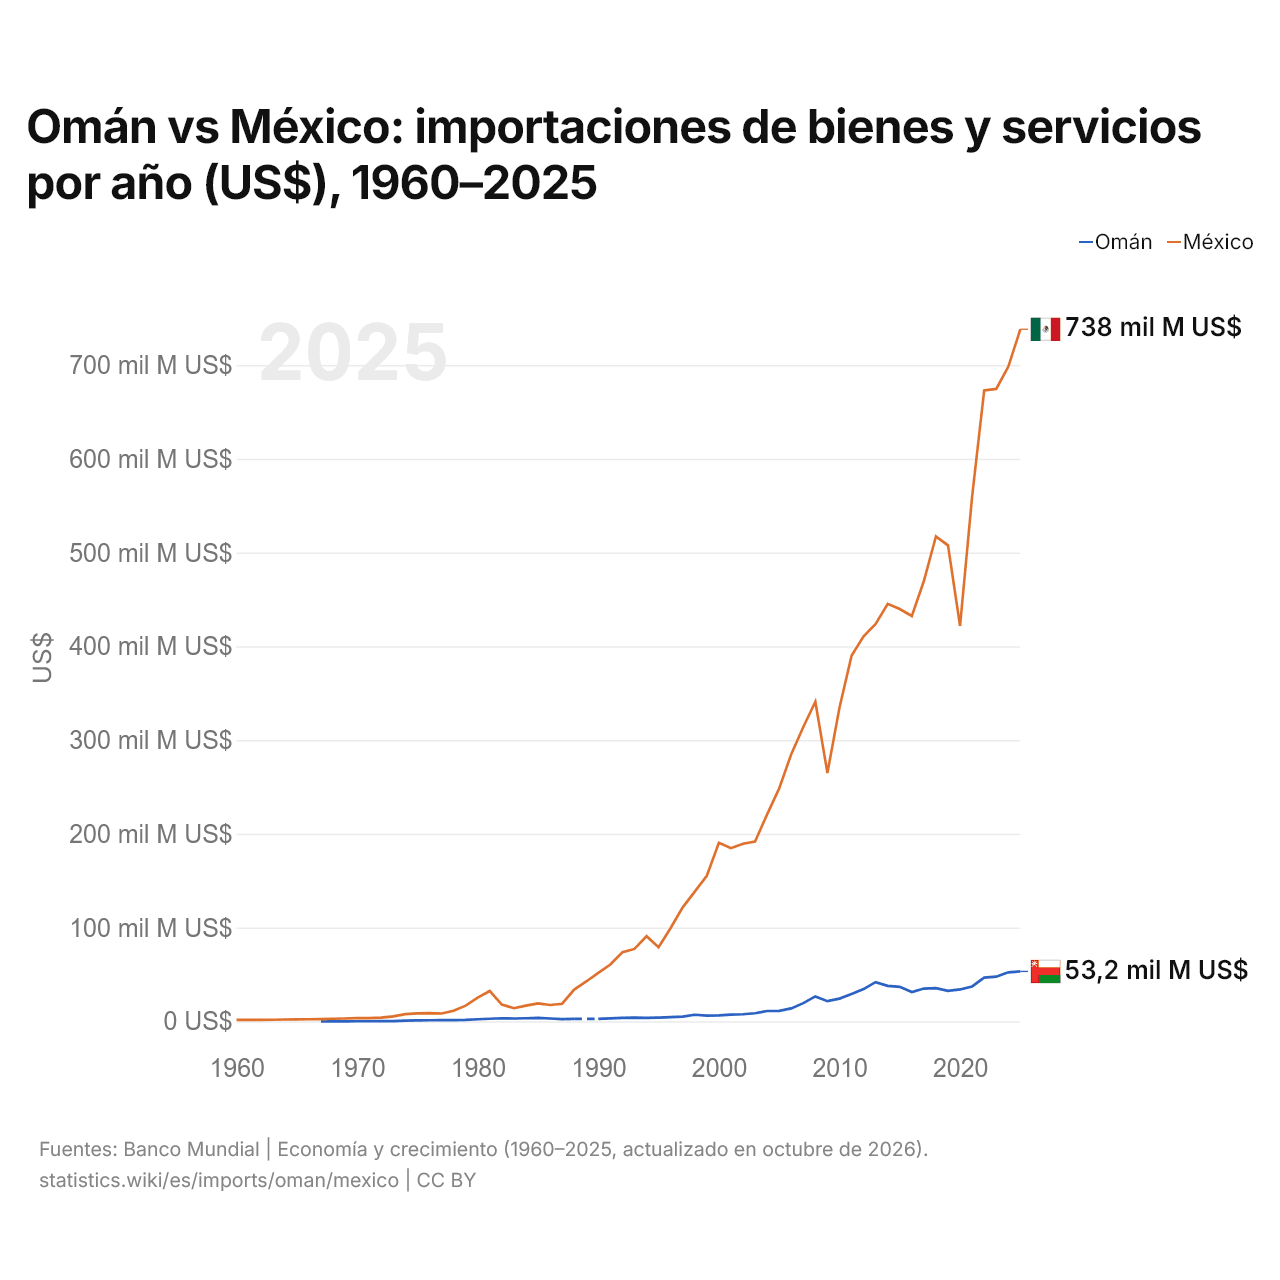
En 2025, las importaciones de bienes y servicios de Omán fueron de 53,2 mil millones de US$ y las de México, de 738 mil millones de US$: las de México fueron 14 veces mayores. En 1967, las importaciones de México fueron 100 veces mayores: 24 millones de US$ de Omán y 2,39 mil millones de US$ de México.
Omán vs México: cifras de importaciones
|
Omán
|
México
|
|
|---|---|---|
| Importaciones | 53,2 mil M US$ (2025) | 738 mil M US$ (2025) |
| Puesto mundial | 67/174 | 13/174 |
| Porcentaje del mundo | 0,16 % | 2,19 % |
| % del PIB | 48,5 % | 40,3 % |
| Mayor categoría de bienes | Maquinaria, electrónica y vehículos (30,8 %, 2025) | Maquinaria, electrónica y vehículos (55,3 %, 2025) |
| Principal origen de bienes | China (16,3 %, 2025) | Estados Unidos (37,7 %, 2025) |
Comparar las importaciones de 2 países cualesquiera
Fuentes:
- Banco Mundial | Economía y crecimiento (1960–2025, actualizado en octubre de 2026)
- TradeMap (2001–2025, actualizado en octubre de 2026)
Creative Commons Atribución (CC BY): puedes copiar, compartir, adaptar y reutilizar este contenido, también con fines comerciales, siempre que cites a statistics.wiki e indiques los cambios que hayas hecho. Las fuentes indicadas arriba pueden tener sus propias condiciones de licencia.