
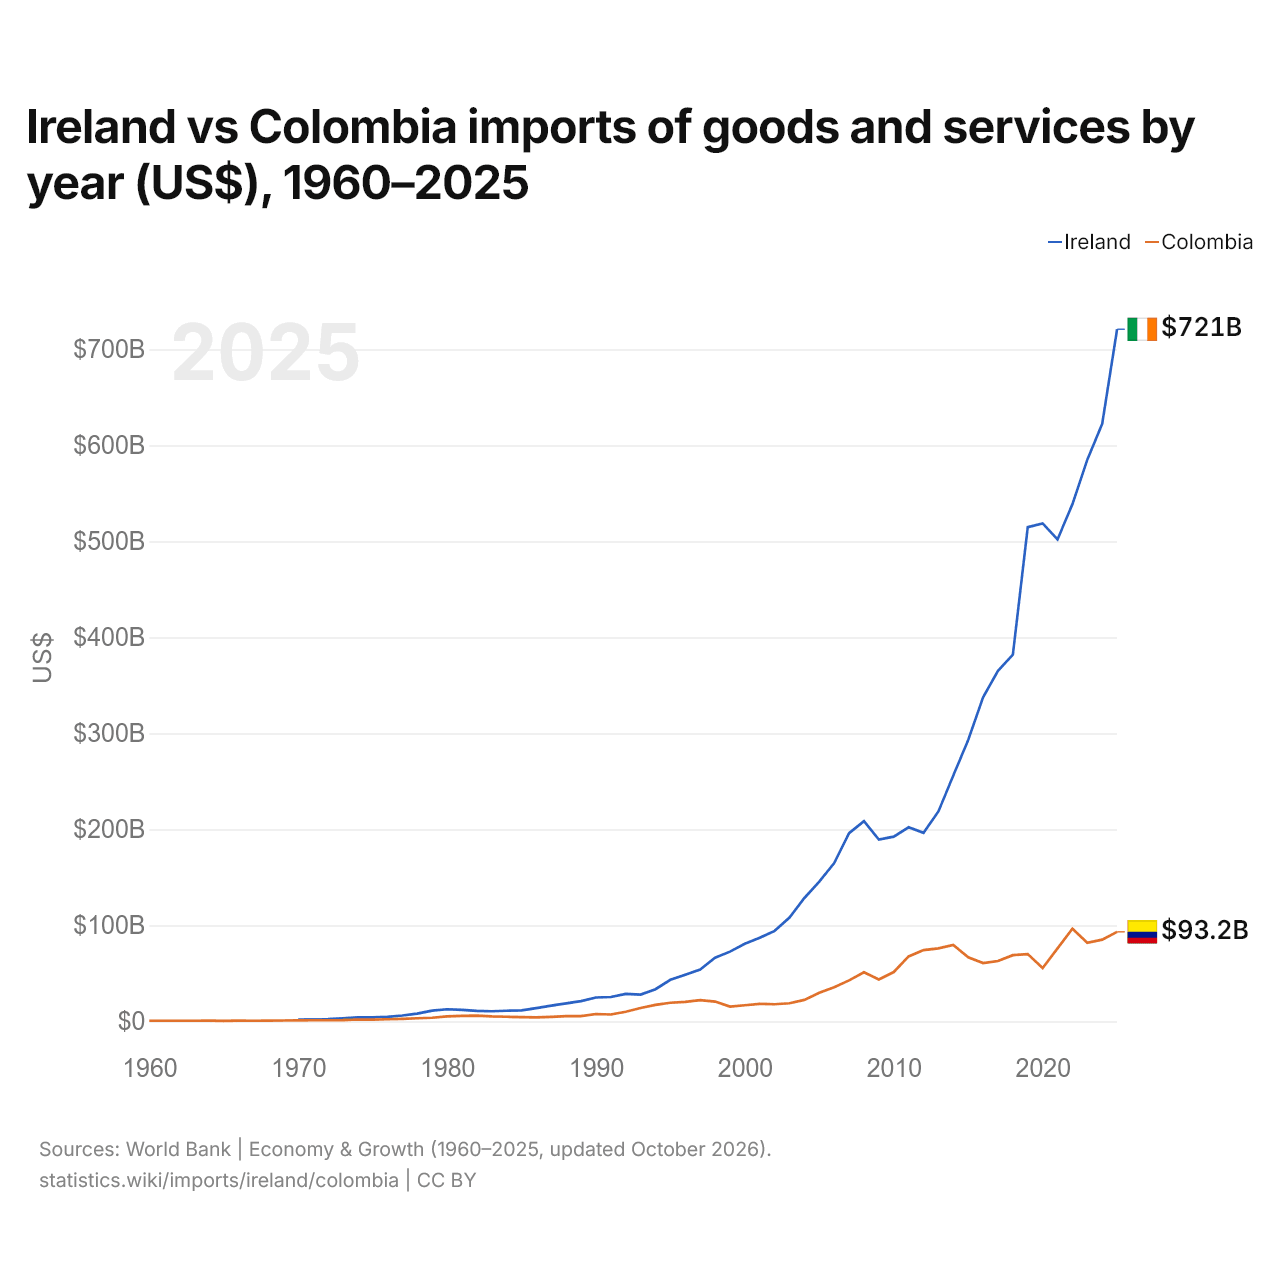
Irlanda vs Colombia: importaciones de bienes y servicios por año (US$), 1960–2025
| Año | US$ | |
|---|---|---|
 Irlanda |
 Colombia |
|
| 2025 | 720.923.704.651 US$ | 93.242.618.943 US$ |
| 2024 | 622.469.214.439 US$ | 85.099.669.252 US$ |
| 2023 | 585.093.268.388 US$ | 81.912.779.953 US$ |
| 2022 | 538.742.737.110 US$ | 96.411.719.931 US$ |
| 2021 | 501.936.785.224 US$ | 76.006.795.312 US$ |
| 2020 | 518.713.605.706 US$ | 55.511.423.807 US$ |
| 2019 | 514.830.799.947 US$ | 70.067.176.051 US$ |
| 2018 | 381.868.643.805 US$ | 68.961.912.989 US$ |
| 2017 | 365.103.478.210 US$ | 62.802.582.424 US$ |
| 2016 | 337.593.450.587 US$ | 60.743.865.897 US$ |
| 2015 | 293.084.919.846 US$ | 66.653.739.136 US$ |
| 2014 | 256.055.573.294 US$ | 79.499.076.760 US$ |
| 2013 | 218.622.360.431 US$ | 76.037.444.586 US$ |
| 2012 | 196.364.505.336 US$ | 74.226.993.322 US$ |
| 2011 | 202.164.282.000 US$ | 67.642.788.202 US$ |
| 2010 | 192.360.308.446 US$ | 51.351.305.097 US$ |
| 2009 | 189.237.997.749 US$ | 43.545.176.395 US$ |
| 2008 | 208.530.667.033 US$ | 51.066.655.641 US$ |
| 2007 | 195.969.684.482 US$ | 42.618.891.608 US$ |
| 2006 | 164.818.339.201 US$ | 35.453.316.065 US$ |
| 2005 | 145.449.057.042 US$ | 29.777.716.182 US$ |
| 2004 | 128.503.157.353 US$ | 22.356.075.160 US$ |
| 2003 | 108.173.694.049 US$ | 18.873.043.327 US$ |
| 2002 | 94.222.138.296 US$ | 17.793.883.920 US$ |
| 2001 | 87.057.814.273 US$ | 18.180.843.172 US$ |
| 2000 | 80.732.344.853 US$ | 16.731.018.377 US$ |
| 1999 | 72.598.943.756 US$ | 15.343.463.758 US$ |
| 1998 | 66.249.949.535 US$ | 20.576.289.396 US$ |
| 1997 | 53.976.683.381 US$ | 22.137.740.206 US$ |
| 1996 | 48.476.633.065 US$ | 20.252.680.332 US$ |
| 1995 | 43.269.875.000 US$ | 19.392.751.884 US$ |
| 1994 | 33.418.612.485 US$ | 17.091.698.826 US$ |
| 1993 | 27.904.818.002 US$ | 13.949.161.891 US$ |
| 1992 | 28.596.731.877 US$ | 9.985.578.591 US$ |
| 1991 | 25.321.115.477 US$ | 7.098.679.409 US$ |
| 1990 | 24.812.175.329 US$ | 7.614.454.665 US$ |
| 1989 | 21.007.092.309 US$ | 5.464.066.789 US$ |
| 1988 | 18.745.179.364 US$ | 5.433.539.691 US$ |
| 1987 | 16.385.098.315 US$ | 4.697.932.910 US$ |
| 1986 | 13.790.559.559 US$ | 4.190.788.878 US$ |
| 1985 | 11.426.996.752 US$ | 4.370.638.535 US$ |
| 1984 | 11.057.699.334 US$ | 4.767.852.803 US$ |
| 1983 | 10.545.459.528 US$ | 5.127.945.979 US$ |
| 1982 | 10.937.756.539 US$ | 5.919.610.897 US$ |
| 1981 | 11.905.906.959 US$ | 5.610.414.541 US$ |
| 1980 | 12.600.904.677 US$ | 5.209.514.725 US$ |
| 1979 | 11.135.980.013 US$ | 3.756.624.824 US$ |
| 1978 | 8.058.103.292 US$ | 3.210.026.858 US$ |
| 1977 | 6.049.699.134 US$ | 2.569.926.742 US$ |
| 1976 | 4.710.653.835 US$ | 2.131.690.445 US$ |
| 1975 | 4.251.090.592 US$ | 1.835.324.549 US$ |
| 1974 | 4.151.309.151 US$ | 1.933.488.606 US$ |
| 1973 | 3.083.459.386 US$ | 1.306.397.078 US$ |
| 1972 | 2.318.300.551 US$ | 1.109.769.650 US$ |
| 1971 | 2.033.167.880 US$ | 1.252.577.345 US$ |
| 1970 | 1.817.051.597 US$ | 1.047.700.632 US$ |
| 1969 | - | 839.120.872 US$ |
| 1968 | - | 763.579.000 US$ |
| 1967 | - | 602.411.300 US$ |
| 1966 | - | 778.814.815 US$ |
| 1965 | - | 559.333.333 US$ |
| 1964 | - | 755.727.700 US$ |
| 1963 | - | 597.285.656 US$ |
| 1962 | - | 605.929.809 US$ |
| 1961 | - | 627.934.716 US$ |
| 1960 | - | 594.894.695 US$ |
En 2025, las importaciones de bienes y servicios de Irlanda fueron de 721 mil millones de US$ y las de Colombia, de 93,2 mil millones de US$: las de Irlanda fueron 7,7 veces mayores. En 1970, las importaciones de Irlanda fueron 1,7 veces mayores: 1,82 mil millones de US$ de Irlanda y 1,05 mil millones de US$ de Colombia.
Las importaciones de bienes y servicios de Irlanda han sido mayores que las de Colombia todos los años desde 1970.
Irlanda vs Colombia: cifras de importaciones
|
Irlanda
|
Colombia
|
|
|---|---|---|
| Importaciones | 721 mil M US$ (2025) | 93,2 mil M US$ (2025) |
| Puesto mundial | 15/174 | 52/174 |
| Porcentaje del mundo | 2,14 % | 0,28 % |
| % del PIB | 99,9 % | 20,4 % |
| Mayor categoría de bienes | Maquinaria, electrónica y vehículos (45,5 %, 2025) | Maquinaria, electrónica y vehículos (34 %, 2025) |
| Principal origen de bienes | Estados Unidos (15,7 %, 2025) | China (27,5 %, 2025) |
Comparar las importaciones de 2 países cualesquiera
Fuentes:
- Banco Mundial | Economía y crecimiento (1960–2025, actualizado en octubre de 2026)
- TradeMap (2001–2025, actualizado en octubre de 2026)
Creative Commons Atribución (CC BY): puedes copiar, compartir, adaptar y reutilizar este contenido, también con fines comerciales, siempre que cites a statistics.wiki e indiques los cambios que hayas hecho. Las fuentes indicadas arriba pueden tener sus propias condiciones de licencia.