
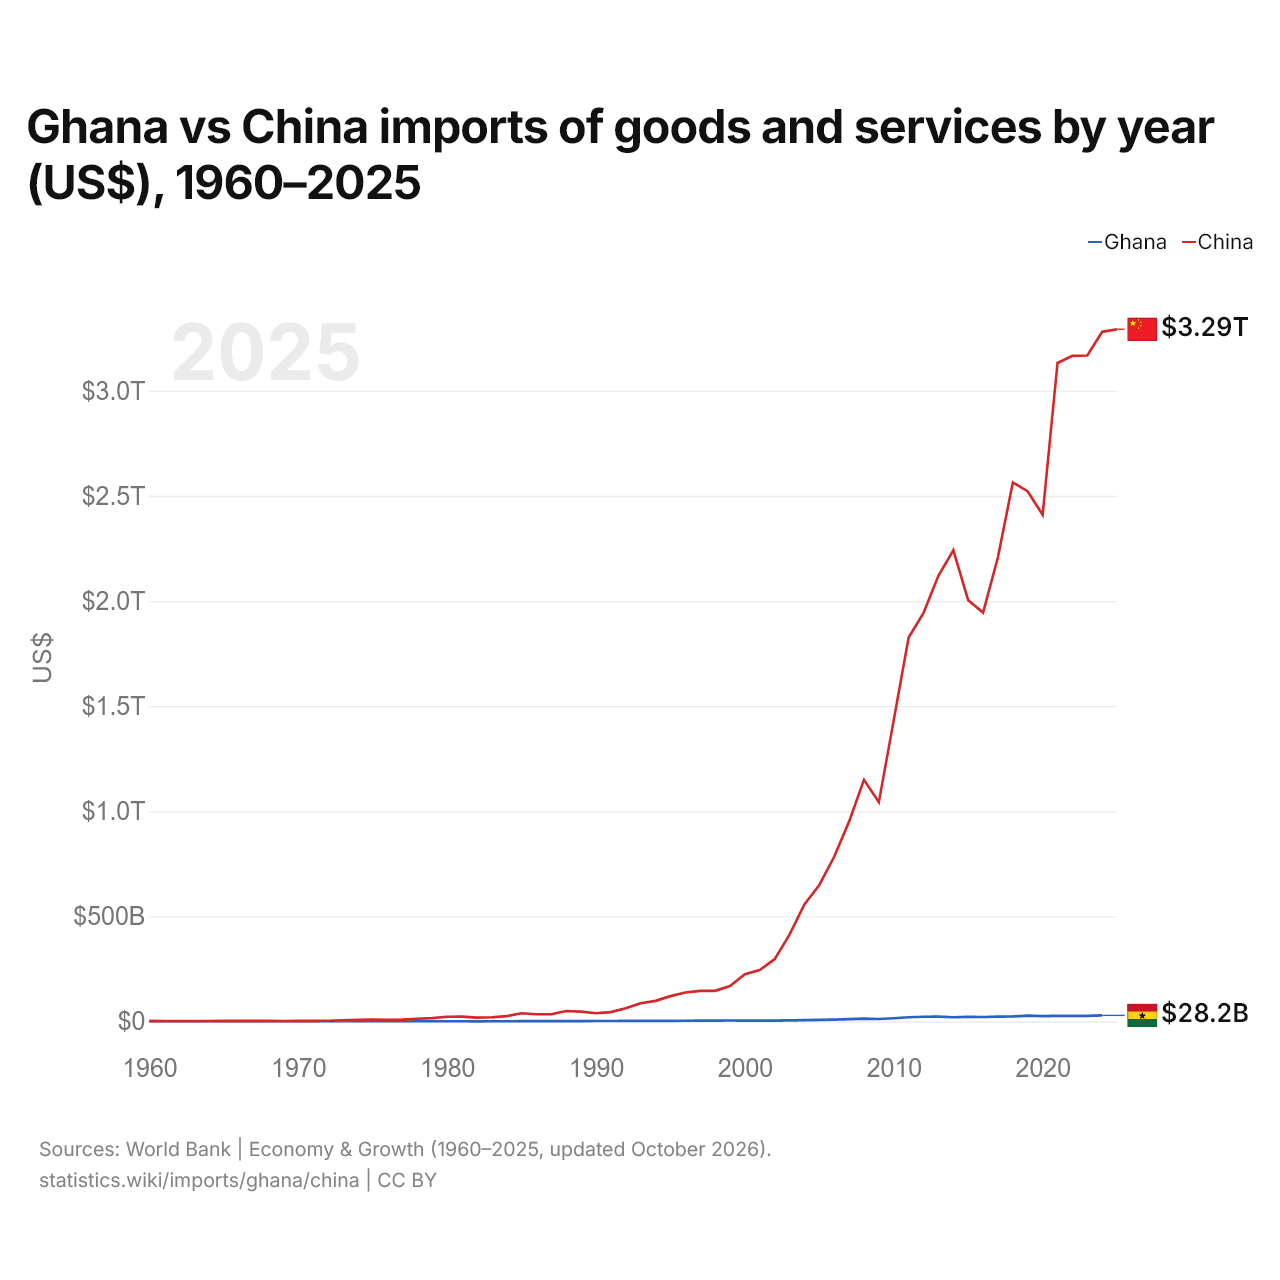
Ghana vs China: importaciones de bienes y servicios por año (US$), 1960–2025
| Año | US$ | |
|---|---|---|
 Ghana |
 China |
|
| 2025 | - | 3.292.280.901.123 US$ |
| 2024 | 28.244.066.026 US$ | 3.280.170.243.047 US$ |
| 2023 | 26.272.099.172 US$ | 3.167.502.597.276 US$ |
| 2022 | 26.205.330.554 US$ | 3.166.016.135.468 US$ |
| 2021 | 25.963.543.827 US$ | 3.132.116.155.606 US$ |
| 2020 | 24.537.944.240 US$ | 2.409.650.385.964 US$ |
| 2019 | 26.913.986.432 US$ | 2.521.036.548.137 US$ |
| 2018 | 23.206.913.262 US$ | 2.564.121.910.995 US$ |
| 2017 | 22.144.229.691 US$ | 2.208.518.918.632 US$ |
| 2016 | 20.595.796.191 US$ | 1.944.490.534.275 US$ |
| 2015 | 21.104.358.074 US$ | 2.003.260.696.069 US$ |
| 2014 | 19.468.106.209 US$ | 2.241.276.198.979 US$ |
| 2013 | 22.196.190.510 US$ | 2.119.392.421.428 US$ |
| 2012 | 21.795.097.067 US$ | 1.943.205.232.867 US$ |
| 2011 | 19.416.125.146 US$ | 1.825.413.639.206 US$ |
| 2010 | 14.779.077.374 US$ | 1.432.422.435.977 US$ |
| 2009 | 11.019.356.825 US$ | 1.042.533.759.653 US$ |
| 2008 | 12.757.957.188 US$ | 1.149.036.249.786 US$ |
| 2007 | 10.136.811.817 US$ | 950.020.767.157 US$ |
| 2006 | 8.325.374.082 US$ | 782.812.463.260 US$ |
| 2005 | 6.631.794.425 US$ | 648.712.207.880 US$ |
| 2004 | 5.361.446.367 US$ | 556.182.551.585 US$ |
| 2003 | 4.320.740.017 US$ | 412.137.124.715 US$ |
| 2002 | 3.383.577.207 US$ | 295.619.639.659 US$ |
| 2001 | 3.444.719.917 US$ | 243.973.790.218 US$ |
| 2000 | 3.350.776.354 US$ | 224.306.238.158 US$ |
| 1999 | 3.830.248.310 US$ | 168.058.444.268 US$ |
| 1998 | 3.496.235.606 US$ | 144.913.704.696 US$ |
| 1997 | 3.651.882.361 US$ | 144.623.820.000 US$ |
| 1996 | 2.779.627.875 US$ | 137.261.877.000 US$ |
| 1995 | 2.128.504.595 US$ | 119.900.826.000 US$ |
| 1994 | 2.002.227.733 US$ | 97.250.445.198 US$ |
| 1993 | 2.173.595.289 US$ | 86.072.328.750 US$ |
| 1992 | 1.845.761.703 US$ | 61.849.400.129 US$ |
| 1991 | 1.685.450.045 US$ | 43.941.659.170 US$ |
| 1990 | 1.522.350.993 US$ | 38.461.758.920 US$ |
| 1989 | 1.278.473.226 US$ | 46.118.793.490 US$ |
| 1988 | 1.250.692.247 US$ | 48.984.701.330 US$ |
| 1987 | 1.328.870.748 US$ | 33.781.853.910 US$ |
| 1986 | 1.154.912.517 US$ | 33.592.580.690 US$ |
| 1985 | 612.106.092 US$ | 38.302.403.274 US$ |
| 1984 | 475.228.311 US$ | 24.710.305.081 US$ |
| 1983 | 242.989.418 US$ | 19.385.304.449 US$ |
| 1982 | 120.354.809 US$ | 17.788.124.795 US$ |
| 1981 | 224.767.442 US$ | 22.219.750.000 US$ |
| 1980 | 406.950.207 US$ | 21.842.710.000 US$ |
| 1979 | 448.717.949 US$ | 15.535.283.000 US$ |
| 1978 | 354.799.302 US$ | 12.261.700.000 US$ |
| 1977 | 368.285.714 US$ | 8.060.398.000 US$ |
| 1976 | 443.644.068 US$ | 7.349.809.000 US$ |
| 1975 | 518.085.106 US$ | 8.355.050.000 US$ |
| 1974 | 631.055.901 US$ | 7.716.198.000 US$ |
| 1973 | 492.968.900 US$ | 5.257.791.000 US$ |
| 1972 | 321.158.623 US$ | 2.916.450.000 US$ |
| 1971 | 489.222.776 US$ | 2.233.127.000 US$ |
| 1970 | 503.014.460 US$ | 2.201.560.000 US$ |
| 1969 | 399.077.749 US$ | 1.731.190.000 US$ |
| 1968 | 347.109.394 US$ | 1.845.220.000 US$ |
| 1967 | 348.508.174 US$ | 1.919.860.000 US$ |
| 1966 | 417.416.074 US$ | 2.185.300.000 US$ |
| 1965 | 549.084.232 US$ | 1.916.420.000 US$ |
| 1964 | 413.213.899 US$ | 1.481.100.000 US$ |
| 1963 | 423.018.974 US$ | 1.210.670.000 US$ |
| 1962 | 393.603.748 US$ | 1.127.720.000 US$ |
| 1961 | 474.845.802 US$ | 1.408.090.000 US$ |
| 1960 | 431.423.325 US$ | 1.890.590.000 US$ |
Las importaciones de bienes y servicios de Ghana fueron de 28,2 mil millones de US$ (2024) y las de China, de 3,28 billones de US$ (2024): las de China fueron 120 veces mayores. En 1960, las importaciones de China fueron 4,4 veces mayores: 431 millones de US$ de Ghana y 1,89 mil millones de US$ de China.
Las importaciones de bienes y servicios de China han sido mayores que las de Ghana todos los años desde 1960.
Ghana vs China: cifras de importaciones
|
Ghana
|
China
|
|
|---|---|---|
| Importaciones | 28,2 mil M US$ (2024) | 3,29 B US$ (2025) |
| Puesto mundial | 84/174 | 2/174 |
| Porcentaje del mundo | 0,09 % | 9,76 % |
| % del PIB | 33,9 % | 16,9 % |
| Mayor categoría de bienes | Petróleo, gas, minerales y otras materias primas (31,8 %, 2025) | Maquinaria, electrónica y vehículos (39,4 %, 2025) |
| Principal origen de bienes | China (22,7 %, 2025) | Corea del Sur (7,26 %, 2025) |
Comparar las importaciones de 2 países cualesquiera
Fuentes:
- Banco Mundial | Economía y crecimiento (1960–2025, actualizado en octubre de 2026)
- TradeMap (2001–2025, actualizado en octubre de 2026)
Creative Commons Atribución (CC BY): puedes copiar, compartir, adaptar y reutilizar este contenido, también con fines comerciales, siempre que cites a statistics.wiki e indiques los cambios que hayas hecho. Las fuentes indicadas arriba pueden tener sus propias condiciones de licencia.