
Gasto en salud por persona por país
| Puesto | País | US$ por persona | $ PPA por persona | Parte del Estado | Parte del pago directo |
|---|---|---|---|---|---|
 Mundo |
1317 US$ | 1891 $ PPA | 61,0 % | 17,4 % | |
| 1 |  Estados Unidos |
13.473 US$ | 13.473 $ PPA | 54,0 % | 10,9 % |
| 2 |  Suiza |
11.784 US$ | 10.602 $ PPA | 33,1 % | 22,0 % |
| 3 |  Liechtenstein |
11.495 US$ | 9795 $ PPA | 69,0 % | 19,7 % |
| 4 |  Noruega |
8296 US$ | 9523 $ PPA | 86,1 % | 13,7 % |
| 5 |  Luxemburgo |
8170 US$ (2024) | 8808 $ PPA | 86,9 % (2024) | 8,5 % (2024) |
| 6 |  Mónaco |
8004 US$ | 9797 $ PPA | 85,7 % | 8,5 % |
| 7 |  Islandia |
7642 US$ (2024) | 6927 $ PPA | 83,6 % | 14,9 % (2024) |
| 8 |  Irlanda |
7395 US$ (2024) | 8772 $ PPA | 76,6 % | 10,6 % (2024) |
| 9 |  Australia |
6980 US$ | 7691 $ PPA | 73,7 % | 15,8 % |
| 10 |  Alemania |
6849 US$ (2024) | 8826 $ PPA | 79,1 % | 10,7 % (2024) |
| 11 |  Países Bajos |
6845 US$ (2024) | 8195 $ PPA | 68,4 % | 11,8 % (2024) |
| 12 |  Dinamarca |
6745 US$ (2024) | 7262 $ PPA | 83,4 % (2024) | 13,9 % (2024) |
| 13 |  Austria |
6739 US$ (2024) | 8250 $ PPA | 76,5 % | 16,5 % (2024) |
| 14 |  Suecia |
6485 US$ (2024) | 7770 $ PPA | 86,1 % | 13,4 % (2024) |
| 15 |  Canadá |
6378 US$ (2024) | 7646 $ PPA | 70,2 % (2024) | 15,3 % (2024) |
| 16 |  Bélgica |
5931 US$ | 7489 $ PPA | 73,7 % | 21,5 % |
| 17 |  Reino Unido |
5860 US$ (2024) | 6606 $ PPA | 81,8 % | 14,6 % (2024) |
| 18 |  Finlandia |
5515 US$ | 6433 $ PPA | 81,1 % | 14,1 % |
| 19 |  Francia |
5327 US$ (2024) | 6868 $ PPA | 68,4 % (2024) | 9,2 % (2024) |
| 20 |  Nueva Zelanda |
5022 US$ (2024) | 5576 $ PPA | 77,7 % | 12,7 % (2024) |
| 21 |  Israel |
3928 US$ | 4033 $ PPA | 65,2 % | 20,5 % |
| 22 |  San Marino |
3924 US$ | 5231 $ PPA | 86,9 % | 13,1 % |
| 23 |  Singapur |
3922 US$ | 6551 $ PPA | 58,5 % | 25,4 % |
| 24 |  Japón |
3638 US$ | 5365 $ PPA | 84,8 % | 12,2 % |
| 25 |  Malta |
3623 US$ | 5706 $ PPA | 66,0 % | 30,9 % |
| 26 |  Andorra |
3605 US$ | 5519 $ PPA | 70,8 % | 11,1 % |
| 27 |  Italia |
3398 US$ (2024) | 4993 $ PPA | 73,1 % | 22,3 % (2024) |
| 28 |  Eslovenia |
3371 US$ (2024) | 5425 $ PPA | 73,2 % | 11,7 % (2024) |
| 29 |  Corea del Sur |
3137 US$ (2024) | 5081 $ PPA | 56,6 % (2024) | 33,7 % (2024) |
| 30 |  España |
3107 US$ | 4935 $ PPA | 73,2 % | 20,9 % |
| 31 |  Portugal |
2971 US$ (2024) | 4928 $ PPA | 61,4 % | 28,2 % (2024) |
| 32 |  Chipre |
2899 US$ | 4538 $ PPA | 76,8 % | 17,9 % |
| 33 |  República Checa |
2693 US$ (2024) | 4674 $ PPA | 84,3 % | 14,1 % (2024) |
| 34 |  Estonia |
2438 US$ (2024) | 3741 $ PPA | 75,8 % | 21,4 % (2024) |
| 35 |  EAU |
2402 US$ | 3727 $ PPA | 66,8 % | 9,7 % |
| 36 |  Nauru |
2292 US$ | 2474 $ PPA | 83,6 % | 0,7 % |
| 37 |  Bahamas |
2262 US$ | 2316 $ PPA | 50,6 % | 27,5 % |
| 38 |  Lituania |
2232 US$ (2024) | 4127 $ PPA | 65,0 % | 31,4 % (2024) |
| 39 |  Uruguay |
2076 US$ | 3135 $ PPA | 72,4 % | 17,1 % |
| 40 |  Polonia |
2014 US$ (2024) | 3939 $ PPA | 77,1 % | 16,2 % (2024) |
| 41 |  Grecia |
1963 US$ | 3454 $ PPA | 50,6 % | 34,3 % |
| 42 |  Arabia Saudí |
1825 US$ | 3475 $ PPA | 77,8 % | 14,1 % |
| 43 |  Eslovaquia |
1813 US$ | 3230 $ PPA | 78,9 % | 20,2 % |
| 44 |  Catar |
1804 US$ | 2901 $ PPA | 83,0 % | 7,4 % |
| 45 |  Chile |
1760 US$ (2024) | 3612 $ PPA | 48,5 % (2024) | 39,1 % (2024) |
| 46 |  Tuvalu |
1724 US$ | 1671 $ PPA | 72,8 % | 0,0 % |
| 47 |  Palaos |
1684 US$ | 1857 $ PPA | 60,9 % | 12,1 % |
| 48 |  Kuwait |
1679 US$ | 2567 $ PPA | 88,5 % | 10,0 % |
| 49 |  Letonia |
1645 US$ | 3034 $ PPA | 59,5 % | 35,1 % |
| 50 |  Panamá |
1558 US$ | 3318 $ PPA | 51,2 % | 40,5 % |
| 51 |  Croacia |
1548 US$ | 3229 $ PPA | 84,0 % | 9,4 % |
| 52 |  Argentina |
1457 US$ | 3089 $ PPA | 60,2 % | 24,5 % |
| 53 |  Hungría |
1420 US$ | 2875 $ PPA | 73,4 % | 23,1 % |
| 54 |  San Cristóbal |
1295 US$ | 1936 $ PPA | 54,3 % | 41,8 % |
| 55 |  Barbados |
1286 US$ | 1153 $ PPA | 41,6 % | 49,5 % |
| 56 |  Trinidad y Tobago |
1276 US$ | 2244 $ PPA | 48,4 % | 45,3 % |
| 57 |  Bulgaria |
1258 US$ | 2970 $ PPA | 62,8 % | 35,5 % |
| 58 |  Cuba |
1199 US$ (2020) | 2883 $ PPA | 91,0 % (2020) | 8,9 % (2020) |
| 59 |  Baréin |
1176 US$ | 2555 $ PPA | 59,3 % | 28,7 % |
| 60 |  Costa Rica |
1163 US$ | 1928 $ PPA | 67,2 % | 24,1 % |
| 61 |  Maldivas |
1159 US$ | 2288 $ PPA | 78,9 % | 18,0 % |
| 62 |  Montenegro |
1148 US$ | 2908 $ PPA | 69,3 % | 26,3 % |
| 63 |  Rumanía |
1051 US$ | 2614 $ PPA | 75,9 % | 23,0 % |
| 64 |  Brasil |
1010 US$ | 2070 $ PPA | 44,1 % | 26,2 % |
| 65 |  Rusia |
1003 US$ | 3204 $ PPA | 70,0 % | 28,4 % |
| 66 |  Serbia |
984 US$ | 2303 $ PPA | 65,5 % | 32,1 % |
| 67 |  Islas Marshall |
894 US$ | 874 $ PPA | 75,0 % | 1,1 % |
| 68 |  Antigua y Barbuda |
841 US$ | 1241 $ PPA | 59,0 % | 20,8 % |
| 69 |  Bosnia |
773 US$ | 1989 $ PPA | 67,3 % | 31,0 % |
| 70 |  Armenia |
767 US$ | 2033 $ PPA | 15,7 % | 80,5 % |
| 71 |  Seychelles |
766 US$ | 1402 $ PPA | 70,3 % | 28,0 % |
| 72 |  China |
763 US$ | 1487 $ PPA | 57,1 % | 32,2 % |
| 73 |  México |
761 US$ | 1368 $ PPA | 48,6 % | 41,2 % |
| 74 |  Brunéi |
733 US$ | 1896 $ PPA | 92,5 % | 7,4 % |
| 75 |  Omán |
732 US$ | 1444 $ PPA | 85,3 % | 6,3 % |
| 76 |  Colombia |
644 US$ (2024) | 1758 $ PPA | 69,8 % (2024) | 14,7 % (2024) |
| 77 |  Santa Lucía |
641 US$ | 1228 $ PPA | 50,4 % | 37,1 % |
| 78 |  Macedonia [...] |
639 US$ | 1808 $ PPA | 57,6 % | 39,6 % |
| 79 |  Mauricio |
616 US$ | 1566 $ PPA | 44,3 % | 45,2 % |
| 80 |  Albania |
591 US$ | 1465 $ PPA | 49,6 % | 48,3 % |
| 81 |  Turkmenistán |
581 US$ | 1264 $ PPA | 17,1 % | 77,4 % |
| 82 |  Bielorrusia |
558 US$ | 2193 $ PPA | 66,8 % | 28,5 % |
| 83 |  Georgia |
554 US$ | 1679 $ PPA | 33,7 % | 58,8 % |
| 84 |  Turquía |
548 US$ | 1769 $ PPA | 75,9 % | 19,0 % |
| 85 |  Sudáfrica |
537 US$ | 1354 $ PPA | 61,6 % | 6,7 % |
| 86 |  Paraguay |
527 US$ | 1469 $ PPA | 55,4 % | 36,3 % |
| 87 |  Granada |
526 US$ | 880 $ PPA | 45,2 % | 48,5 % |
| 88 |  Jamaica |
520 US$ | 869 $ PPA | 64,3 % | 20,2 % |
| 89 |  Ecuador |
509 US$ | 1238 $ PPA | 62,0 % | 30,9 % |
| 90 |  Guyana |
505 US$ | 1331 $ PPA | 70,1 % | 26,3 % |
| 91 |  El Salvador |
501 US$ | 1176 $ PPA | 60,5 % | 32,5 % |
| 92 |  Dominica |
492 US$ | 968 $ PPA | 67,1 % | 29,3 % |
| 93 |  Kazajistán |
490 US$ | 1460 $ PPA | 65,8 % | 27,6 % |
| 94 |  Botsuana |
490 US$ | 1310 $ PPA | 75,5 % | 4,3 % |
| 95 |  República [...] |
489 US$ | 1169 $ PPA | 64,1 % | 25,1 % |
| 96 |  Libia |
470 US$ | 1055 $ PPA | 80,1 % | 19,2 % |
| 97 |  San Vicente [...] |
469 US$ | 908 $ PPA | 69,1 % | 26,6 % |
| 98 |  Moldavia |
452 US$ | 1181 $ PPA | 69,6 % | 27,5 % |
| 99 |  Malasia |
450 US$ | 1441 $ PPA | 50,0 % | 37,1 % |
| 100 |  Perú |
446 US$ | 956 $ PPA | 63,6 % | 27,0 % |
| 101 |  Namibia |
397 US$ | 1068 $ PPA | 58,5 % | 7,5 % |
| 102 |  Guatemala |
392 US$ | 935 $ PPA | 35,8 % | 57,2 % |
| 103 |  Ucrania |
370 US$ (2021) | 1382 $ PPA | 52,1 % (2021) | 45,3 % (2021) |
| 104 |  Mongolia |
360 US$ | 1109 $ PPA | 45,0 % | 48,8 % |
| 105 |  Tonga |
358 US$ | 512 $ PPA | 46,3 % | 5,9 % |
| 106 |  Palestina |
346 US$ | 604 $ PPA | 41,4 % | 42,1 % |
| 107 |  Jordania |
342 US$ | 798 $ PPA | 45,0 % | 34,5 % |
| 108 |  Irak |
333 US$ | 843 $ PPA | 46,0 % | 54,0 % |
| 109 |  Tailandia |
327 US$ | 1067 $ PPA | 77,9 % | 9,9 % |
| 110 |  Túnez |
318 US$ | 1113 $ PPA | 54,1 % | 37,9 % |
| 111 |  Belice |
309 US$ | 573 $ PPA | 65,1 % | 26,8 % |
| 112 |  Azerbaiyán |
300 US$ | 993 $ PPA | 32,6 % | 64,6 % |
| 113 |  Surinam |
297 US$ | 1143 $ PPA | 62,0 % | 19,7 % |
| 114 |  Suazilandia |
296 US$ | 922 $ PPA | 42,7 % | 11,0 % |
| 115 |  Samoa |
293 US$ | 475 $ PPA | 69,2 % | 13,4 % |
| 116 |  Cabo Verde |
290 US$ | 617 $ PPA | 58,6 % | 25,7 % |
| 117 |  Irán |
267 US$ | 1064 $ PPA | 46,7 % | 43,1 % |
| 118 |  Líbano |
261 US$ | 644 $ PPA | 37,9 % | 29,7 % |
| 119 |  Bolivia |
255 US$ | 756 $ PPA | 67,3 % | 27,3 % |
| 120 |  Gabón |
253 US$ | 673 $ PPA | 65,7 % | 17,3 % |
| 121 |  Honduras |
249 US$ | 553 $ PPA | 31,9 % | 53,1 % |
| 122 |  Kiribati |
238 US$ | 401 $ PPA | 78,5 % | 2,9 % |
| 123 |  Guinea Ecuatorial |
234 US$ | 609 $ PPA | 32,3 % | 66,0 % |
| 124 |  Argelia |
233 US$ | 732 $ PPA | 53,1 % | 45,0 % |
| 125 |  Marruecos |
232 US$ | 606 $ PPA | 56,5 % | 37,3 % |
| 126 |  Nicaragua |
217 US$ | 689 $ PPA | 57,4 % | 37,6 % |
| 127 |  Fiyi |
213 US$ | 548 $ PPA | 74,8 % | 8,3 % |
| 128 |  Vietnam |
197 US$ | 690 $ PPA | 44,3 % | 39,2 % |
| 129 |  Filipinas |
194 US$ | 560 $ PPA | 42,4 % | 44,4 % |
| 130 |  Uzbekistán |
192 US$ | 749 $ PPA | 35,4 % | 64,1 % |
| 131 |  Venezuela |
186 US$ | 112 $ PPA | 31,7 % | 29,7 % |
| 132 |  Santo Tomé |
171 US$ | 355 $ PPA | 37,0 % | 16,7 % |
| 133 |  Bután |
162 US$ | 677 $ PPA | 66,7 % | 25,5 % |
| 134 |  Timor Oriental |
144 US$ | 461 $ PPA | 77,7 % | 7,0 % |
| 135 |  Vanuatu |
143 US$ | 141 $ PPA | 56,6 % | 8,4 % |
| 136 |  Egipto |
141 US$ | 905 $ PPA | 32,2 % | 57,2 % |
| 137 |  Sri Lanka |
134 US$ | 507 $ PPA | 33,6 % | 54,8 % |
| 138 |  Indonesia |
132 US$ | 417 $ PPA | 53,6 % | 31,1 % |
| 139 |  Lesoto |
123 US$ | 386 $ PPA | 46,3 % | 13,2 % |
| 140 |  Camboya |
115 US$ | 350 $ PPA | 26,9 % | 60,6 % |
| 141 |  Islas Salomón |
111 US$ | 153 $ PPA | 62,9 % | 3,2 % |
| 142 |  Liberia |
104 US$ | 233 $ PPA | 10,0 % | 63,2 % |
| 143 |  Comoras |
102 US$ | 250 $ PPA | 12,9 % | 56,6 % |
| 144 |  Kirguistán |
97 US$ | 349 $ PPA | 53,3 % | 42,3 % |
| 145 |  Mauritania |
92 US$ | 302 $ PPA | 34,2 % | 43,8 % |
| 146 |  Costa de Marfil |
88 US$ | 249 $ PPA | 40,8 % | 32,0 % |
| 147 |  Papúa Nueva Guinea |
85 US$ | 133 $ PPA | 73,3 % | 8,6 % |
| 148 |  Tayikistán |
85 US$ | 364 $ PPA | 25,6 % | 62,4 % |
| 149 |  Kenia |
85 US$ | 274 $ PPA | 44,9 % | 24,2 % |
| 150 |  India |
85 US$ | 346 $ PPA | 39,0 % | 43,9 % |
| 151 |  Nepal |
84 US$ | 332 $ PPA | 31,3 % | 59,4 % |
| 152 |  Guinea-Bisáu |
82 US$ | 247 $ PPA | 10,6 % | 61,6 % |
| 153 |  Zambia |
80 US$ | 244 $ PPA | 40,7 % | 10,3 % |
| 154 |  Camerún |
79 US$ | 246 $ PPA | 14,7 % | 67,7 % |
| 155 |  Yibuti |
78 US$ | 155 $ PPA | 46,1 % | 28,8 % |
| 156 |  Angola |
76 US$ | 248 $ PPA | 44,5 % | 32,5 % |
| 157 |  Congo (Rep.) |
76 US$ | 209 $ PPA | 34,0 % | 28,0 % |
| 158 |  Senegal |
73 US$ | 206 $ PPA | 27,6 % | 44,3 % |
| 159 |  Sudán del Sur |
73 US$ | 158 $ PPA | 4,3 % | 27,1 % |
| 160 |  Burkina Faso |
72 US$ | 224 $ PPA | 31,4 % | 43,8 % |
| 161 |  Ghana |
70 US$ | 234 $ PPA | 63,2 % | 26,7 % |
| 162 |  Nigeria |
67 US$ | 260 $ PPA | 14,3 % | 71,9 % |
| 163 |  Zimbabue |
63 US$ | 103 $ PPA | 32,4 % | 10,6 % |
| 164 |  Togo |
60 US$ | 186 $ PPA | 11,1 % | 64,3 % |
| 165 |  Guinea |
59 US$ | 169 $ PPA | 21,8 % | 54,4 % |
| 166 |  Afganistán |
59 US$ | 330 $ PPA | 1,7 % | 77,1 % |
| 167 |  Birmania |
56 US$ | 283 $ PPA | 11,1 % | 71,1 % |
| 168 |  Haití |
54 US$ | 105 $ PPA | 9,3 % | 52,4 % |
| 169 |  RCA |
54 US$ | 137 $ PPA | 14,4 % | 45,0 % |
| 170 |  Bangladés |
53 US$ | 199 $ PPA | 14,5 % | 79,3 % |
| 171 |  Mozambique |
53 US$ | 143 $ PPA | 26,5 % | 10,4 % |
| 172 |  Ruanda |
53 US$ | 177 $ PPA | 47,0 % | 4,1 % |
| 173 |  Yemen |
48 US$ | 169 $ PPA | 8,4 % | 69,1 % |
| 174 |  Chad |
47 US$ | 130 $ PPA | 25,2 % | 51,7 % |
| 175 |  Benín |
47 US$ | 138 $ PPA | 14,7 % | 42,4 % |
| 176 |  Uganda |
45 US$ | 139 $ PPA | 21,8 % | 32,2 % |
| 177 |  Malaui |
41 US$ | 125 $ PPA | 12,8 % | 12,0 % |
| 178 |  Tanzania |
36 US$ | 119 $ PPA | 31,7 % | 27,9 % |
| 179 |  Sierra Leona |
36 US$ | 159 $ PPA | 16,7 % | 54,5 % |
| 180 |  Etiopía |
35 US$ | 86 $ PPA | 21,9 % | 46,3 % |
| 181 |  Mali |
34 US$ | 104 $ PPA | 35,4 % | 47,2 % |
| 182 |  Siria |
33 US$ | 122 $ PPA | 14,9 % | 72,4 % |
| 183 |  Pakistán |
30 US$ | 152 $ PPA | 35,7 % | 52,9 % |
| 184 |  Eritrea |
28 US$ | 87 $ PPA | 23,1 % | 48,4 % |
| 185 |  Burundi |
28 US$ | 100 $ PPA | 14,7 % | 24,5 % |
| 186 |  Laos |
27 US$ | 123 $ PPA | 39,8 % | 44,8 % |
| 187 |  Níger |
26 US$ | 76 $ PPA | 24,0 % | 51,5 % |
| 188 |  Gambia |
26 US$ | 94 $ PPA | 44,9 % | 33,8 % |
| 189 |  RDC |
23 US$ | 58 $ PPA | 18,7 % | 38,0 % |
| 190 |  Somalia |
22 US$ | 52 $ PPA | 14,2 % | 30,8 % |
| 191 |  Sudán |
21 US$ | 28 $ PPA | 20,7 % | 57,4 % |
| 192 |  Madagascar |
17 US$ | 63 $ PPA | 28,8 % | 27,4 % |
La lista ordena 192 países por su gasto en salud por persona más reciente en US$: el más alto es el de Estados Unidos (13.473 US$) y el más bajo, el de Madagascar (17 US$). El mundo gasta en salud 1317 US$ por persona. La mitad de los países gasta menos de 470 US$ por persona. Los Estados pagan el 61,0 % del gasto en salud del mundo, y los hogares, el 17,4 % mediante pagos directos.
El gasto en salud por persona es el gasto corriente en salud de un país, lo que se gasta en un año en atención, medicamentos y otros productos sanitarios, prevención y funcionamiento del sistema de salud, dividido por su población. En US$ se convierte a los tipos de cambio de mercado; en dólares PPA, a las paridades de poder adquisitivo, que tienen en cuenta los distintos niveles de precios de los países. La tabla ordena por US$ y muestra quién paga: la parte del Estado y la parte que los hogares pagan directamente.
Mapa del gasto en salud por persona (US$)
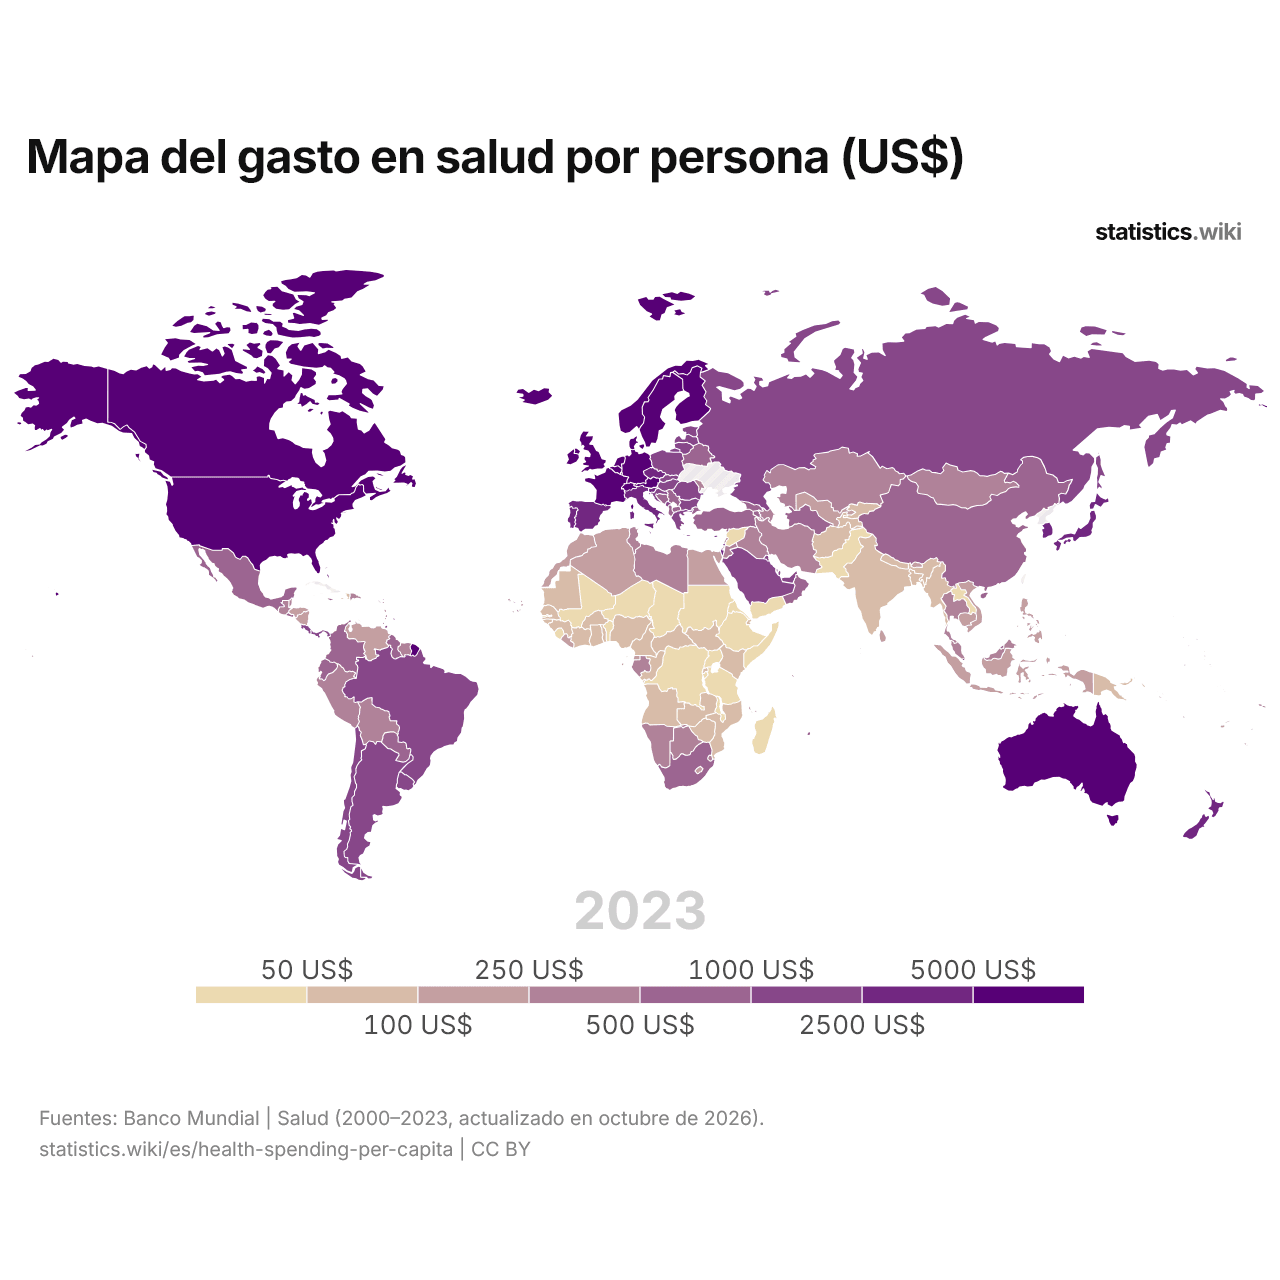
El gasto en salud supera los 5000 US$ por persona en 19 países y es inferior a 100 US$ en 49; en 2000, las cifras eran 0 y 92.
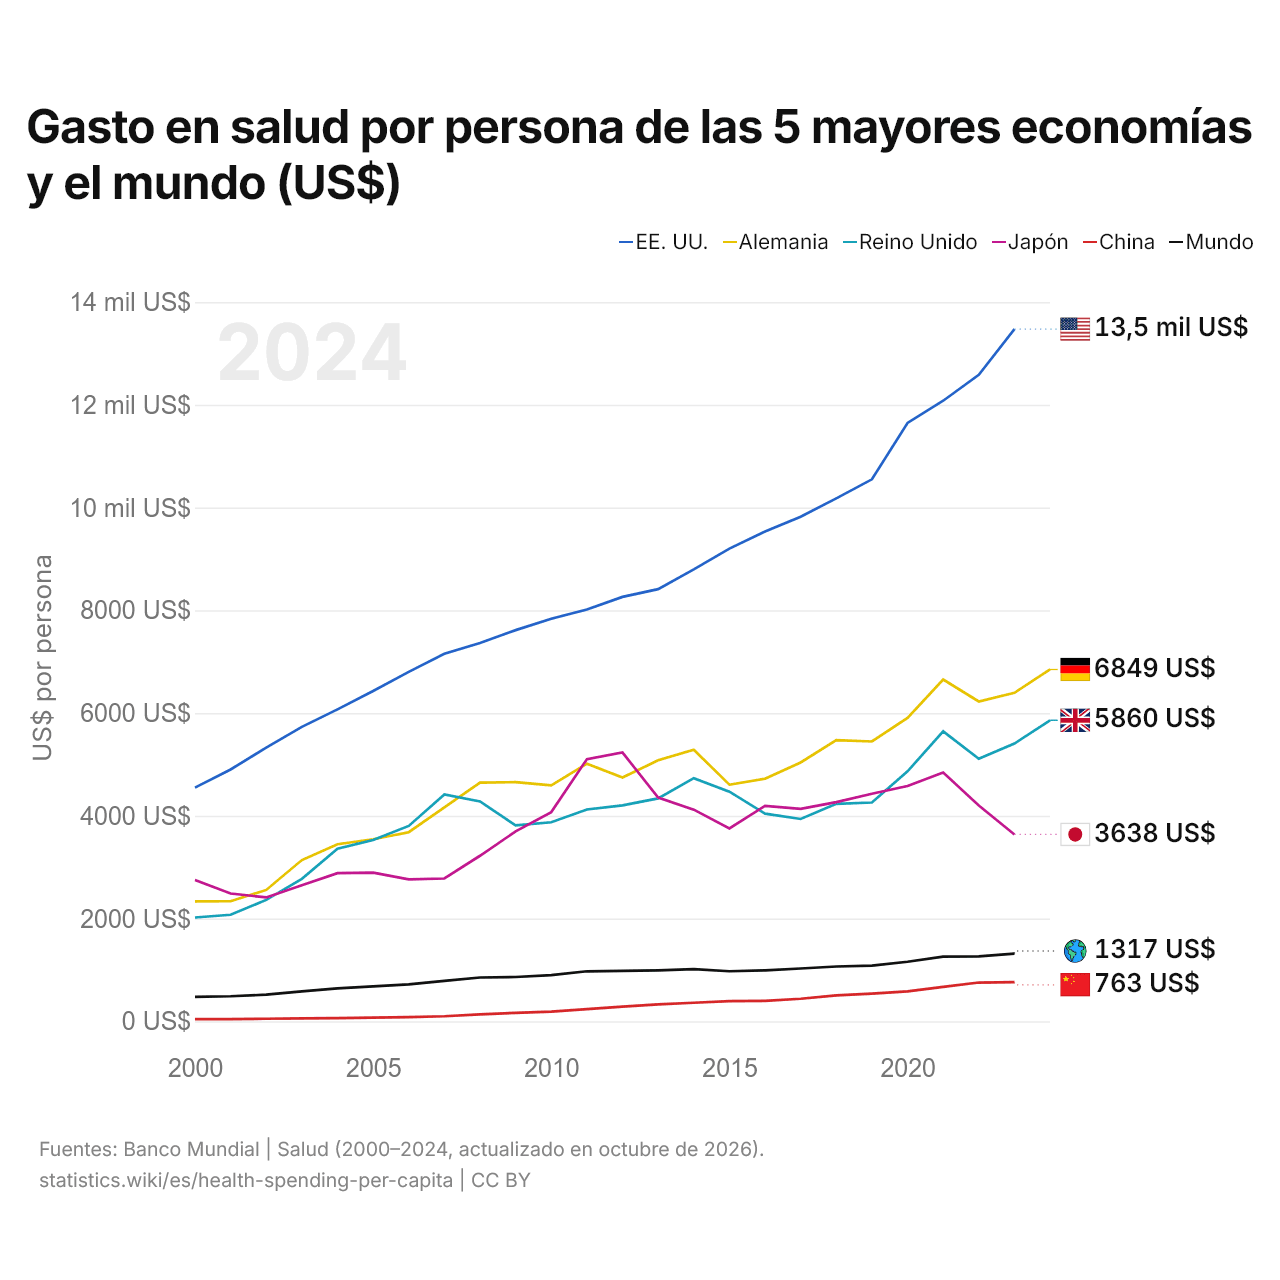
Gasto en salud por persona de las 5 mayores economías y el mundo (US$)
| Año | US$ por persona | |||||
|---|---|---|---|---|---|---|
| Estados Unidos | Alemania | Reino Unido | Japón | China | Mundo | |
| 2024 | - | 6.849 US$ | 5.860 US$ | - | - | - |
| 2023 | 13.473 US$ | 6.395 US$ | 5.407 US$ | 3.638 US$ | 763 US$ | 1.317 US$ |
| 2022 | 12.586 US$ | 6.226 US$ | 5.112 US$ | 4.202 US$ | 755 US$ | 1.266 US$ |
| 2021 | 12.080 US$ | 6.654 US$ | 5.645 US$ | 4.844 US$ | 670 US$ | 1.258 US$ |
| 2020 | 11.648 US$ | 5.907 US$ | 4.866 US$ | 4.582 US$ | 583 US$ | 1.160 US$ |
| 2019 | 10.550 US$ | 5.447 US$ | 4.260 US$ | 4.431 US$ | 539 US$ | 1.085 US$ |
| 2018 | 10.180 US$ | 5.474 US$ | 4.234 US$ | 4.266 US$ | 504 US$ | 1.067 US$ |
| 2017 | 9.823 US$ | 5.039 US$ | 3.939 US$ | 4.135 US$ | 440 US$ | 1.028 US$ |
| 2016 | 9.536 US$ | 4.723 US$ | 4.043 US$ | 4.194 US$ | 398 US$ | 992 US$ |
| 2015 | 9.201 US$ | 4.606 US$ | 4.470 US$ | 3.754 US$ | 393 US$ | 975 US$ |
| 2014 | 8.796 US$ | 5.287 US$ | 4.733 US$ | 4.121 US$ | 362 US$ | 1.016 US$ |
| 2013 | 8.412 US$ | 5.081 US$ | 4.340 US$ | 4.356 US$ | 329 US$ | 993 US$ |
| 2012 | 8.262 US$ | 4.745 US$ | 4.204 US$ | 5.232 US$ | 285 US$ | 982 US$ |
| 2011 | 8.016 US$ | 5.016 US$ | 4.124 US$ | 5.103 US$ | 239 US$ | 974 US$ |
| 2010 | 7.836 US$ | 4.592 US$ | 3.876 US$ | 4.072 US$ | 189 US$ | 900 US$ |
| 2009 | 7.615 US$ | 4.655 US$ | 3.813 US$ | 3.697 US$ | 165 US$ | 863 US$ |
| 2008 | 7.365 US$ | 4.647 US$ | 4.280 US$ | 3.223 US$ | 134 US$ | 854 US$ |
| 2007 | 7.154 US$ | 4.163 US$ | 4.416 US$ | 2.781 US$ | 99 US$ | 789 US$ |
| 2006 | 6.802 US$ | 3.681 US$ | 3.803 US$ | 2.764 US$ | 82 US$ | 720 US$ |
| 2005 | 6.429 US$ | 3.545 US$ | 3.528 US$ | 2.893 US$ | 73 US$ | 680 US$ |
| 2004 | 6.072 US$ | 3.447 US$ | 3.362 US$ | 2.885 US$ | 64 US$ | 640 US$ |
| 2003 | 5.732 US$ | 3.139 US$ | 2.774 US$ | 2.650 US$ | 57 US$ | 583 US$ |
| 2002 | 5.328 US$ | 2.558 US$ | 2.364 US$ | 2.412 US$ | 50 US$ | 519 US$ |
| 2001 | 4.902 US$ | 2.338 US$ | 2.075 US$ | 2.489 US$ | 44 US$ | 488 US$ |
| 2000 | 4.549 US$ | 2.336 US$ | 2.021 US$ | 2.751 US$ | 43 US$ | 476 US$ |
El gasto en salud por persona es de 13.473 US$ en Estados Unidos, 6849 US$ en Alemania (2024), 5860 US$ en el Reino Unido (2024), 3638 US$ en Japón y 763 US$ en China. El gasto en salud por persona de Estados Unidos ha sido el más alto de las cinco todos los años desde 2000. El cambio más reciente en su orden fue en 2020, cuando el gasto por persona del Reino Unido superó al de Japón.
Comparar el gasto en salud per cápita de dos países
Fuentes:
- Banco Mundial | Salud (2000–2024, actualizado en octubre de 2026)
Creative Commons Atribución (CC BY): puedes copiar, compartir, adaptar y reutilizar este contenido, también con fines comerciales, siempre que cites a statistics.wiki e indiques los cambios que hayas hecho. Las fuentes indicadas arriba pueden tener sus propias condiciones de licencia.