
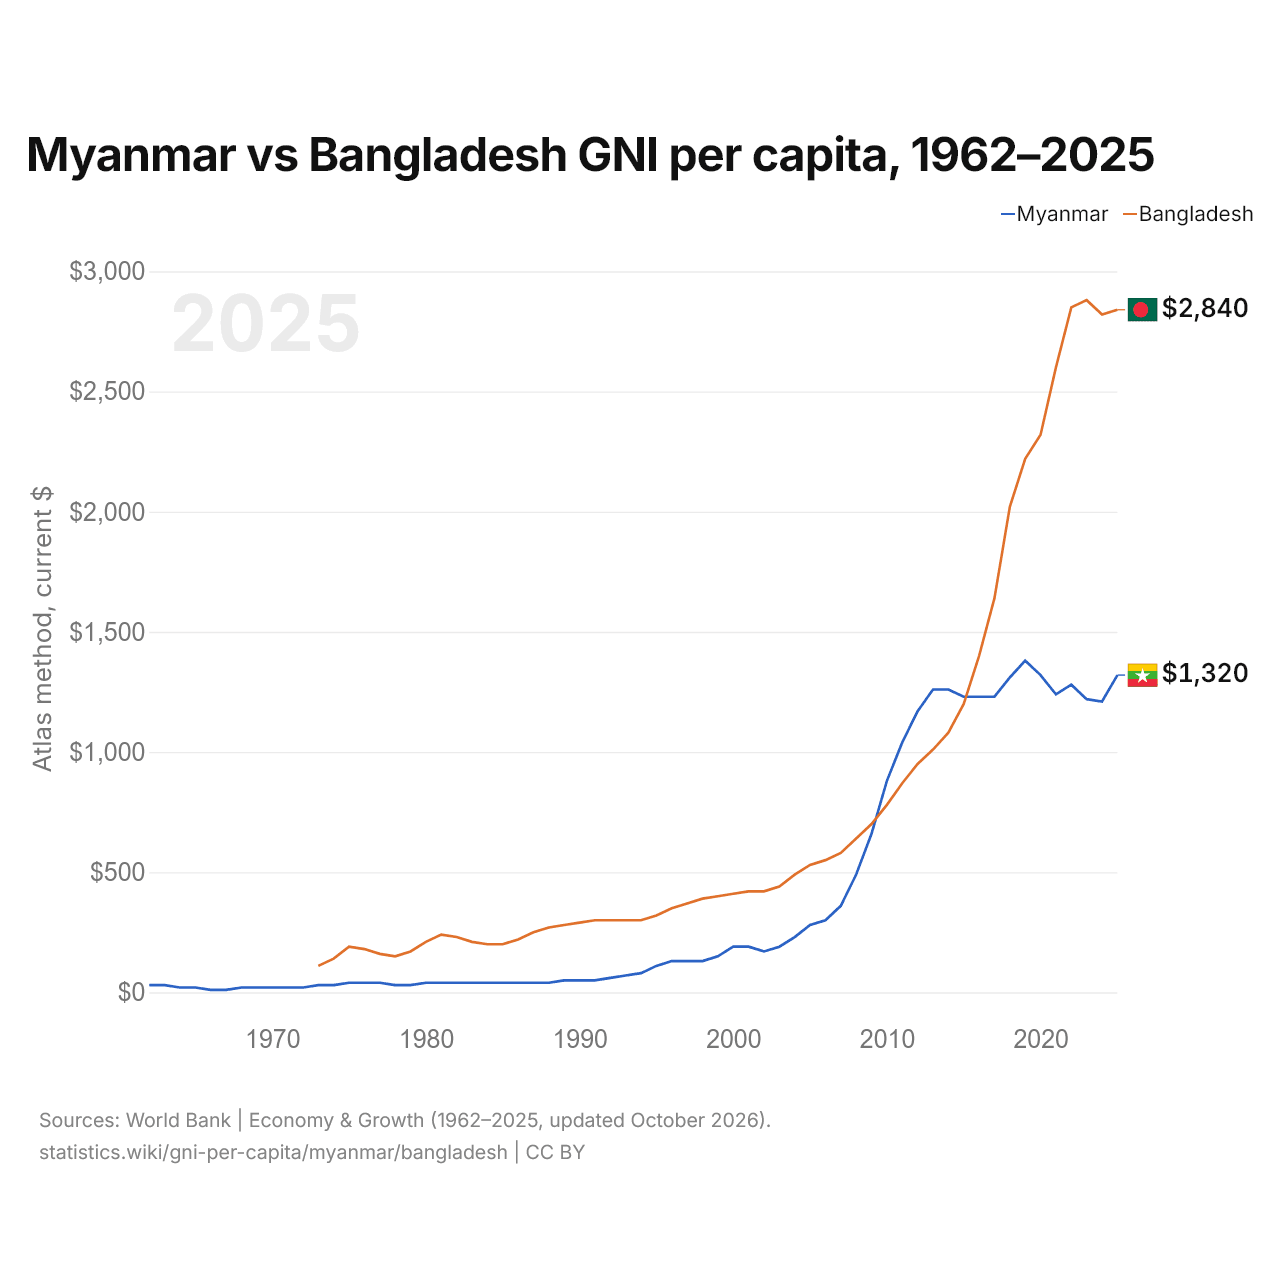
Birmania vs Bangladés: INB per cápita, 1962–2025
| Año | Método Atlas, US$ corrientes | |
|---|---|---|
 Birmania |
 Bangladés |
|
| 2025 | 1.320 US$ | 2.840 US$ |
| 2024 | 1.210 US$ | 2.820 US$ |
| 2023 | 1.220 US$ | 2.880 US$ |
| 2022 | 1.280 US$ | 2.850 US$ |
| 2021 | 1.240 US$ | 2.600 US$ |
| 2020 | 1.320 US$ | 2.320 US$ |
| 2019 | 1.380 US$ | 2.220 US$ |
| 2018 | 1.310 US$ | 2.020 US$ |
| 2017 | 1.230 US$ | 1.640 US$ |
| 2016 | 1.230 US$ | 1.400 US$ |
| 2015 | 1.230 US$ | 1.200 US$ |
| 2014 | 1.260 US$ | 1.080 US$ |
| 2013 | 1.260 US$ | 1.010 US$ |
| 2012 | 1.170 US$ | 950 US$ |
| 2011 | 1.040 US$ | 870 US$ |
| 2010 | 880 US$ | 780 US$ |
| 2009 | 660 US$ | 700 US$ |
| 2008 | 490 US$ | 640 US$ |
| 2007 | 360 US$ | 580 US$ |
| 2006 | 300 US$ | 550 US$ |
| 2005 | 280 US$ | 530 US$ |
| 2004 | 230 US$ | 490 US$ |
| 2003 | 190 US$ | 440 US$ |
| 2002 | 170 US$ | 420 US$ |
| 2001 | 190 US$ | 420 US$ |
| 2000 | 190 US$ | 410 US$ |
| 1999 | 150 US$ | 400 US$ |
| 1998 | 130 US$ | 390 US$ |
| 1997 | 130 US$ | 370 US$ |
| 1996 | 130 US$ | 350 US$ |
| 1995 | 110 US$ | 320 US$ |
| 1994 | 80 US$ | 300 US$ |
| 1993 | 70 US$ | 300 US$ |
| 1992 | 60 US$ | 300 US$ |
| 1991 | 50 US$ | 300 US$ |
| 1990 | 50 US$ | 290 US$ |
| 1989 | 50 US$ | 280 US$ |
| 1988 | 40 US$ | 270 US$ |
| 1987 | 40 US$ | 250 US$ |
| 1986 | 40 US$ | 220 US$ |
| 1985 | 40 US$ | 200 US$ |
| 1984 | 40 US$ | 200 US$ |
| 1983 | 40 US$ | 210 US$ |
| 1982 | 40 US$ | 230 US$ |
| 1981 | 40 US$ | 240 US$ |
| 1980 | 40 US$ | 210 US$ |
| 1979 | 30 US$ | 170 US$ |
| 1978 | 30 US$ | 150 US$ |
| 1977 | 40 US$ | 160 US$ |
| 1976 | 40 US$ | 180 US$ |
| 1975 | 40 US$ | 190 US$ |
| 1974 | 30 US$ | 140 US$ |
| 1973 | 30 US$ | 110 US$ |
| 1972 | 20 US$ | - |
| 1971 | 20 US$ | - |
| 1970 | 20 US$ | - |
| 1969 | 20 US$ | - |
| 1968 | 20 US$ | - |
| 1967 | 10 US$ | - |
| 1966 | 10 US$ | - |
| 1965 | 20 US$ | - |
| 1964 | 20 US$ | - |
| 1963 | 30 US$ | - |
| 1962 | 30 US$ | - |
En 2025, el INB per cápita según el método Atlas fue de 1320 US$ en Birmania y de 2840 US$ en Bangladés: 2,2 veces más alto en Bangladés. En 1973 era de 30 US$ en Birmania y de 110 US$ en Bangladés, 3,7 veces más alto en Bangladés.
El INB per cápita de Bangladés ha sido más alto que el de Birmania todos los años desde 2016. Convertido según la paridad del poder adquisitivo, el INB per cápita fue de 5890 dólares en Birmania y de 10.710 dólares en Bangladés en 2025: 1,8 veces más alto en Bangladés.
Birmania vs Bangladés: últimos datos del INB per cápita
Comparar el INB per cápita de 2 países cualesquiera
Fuentes:
- Banco Mundial | Economía y crecimiento (1962–2025, actualizado en octubre de 2026)
Creative Commons Atribución (CC BY): puedes copiar, compartir, adaptar y reutilizar este contenido, también con fines comerciales, siempre que cites a statistics.wiki e indiques los cambios que hayas hecho. Las fuentes indicadas arriba pueden tener sus propias condiciones de licencia.