
Irlanda vs Alemania: INB per cápita, 1962–2025
| Año | Método Atlas, US$ corrientes | |
|---|---|---|
 Irlanda |
 Alemania |
|
| 2025 | 87.360 US$ | 60.200 US$ |
| 2024 | 80.650 US$ | 55.090 US$ |
| 2023 | 79.280 US$ | 55.420 US$ |
| 2022 | 75.970 US$ | 55.200 US$ |
| 2021 | 74.070 US$ | 52.850 US$ |
| 2020 | 64.420 US$ | 48.540 US$ |
| 2019 | 62.460 US$ | 50.350 US$ |
| 2018 | 59.110 US$ | 48.770 US$ |
| 2017 | 54.410 US$ | 44.730 US$ |
| 2016 | 52.880 US$ | 45.340 US$ |
| 2015 | 52.340 US$ | 46.590 US$ |
| 2014 | 47.580 US$ | 48.610 US$ |
| 2013 | 44.170 US$ | 48.160 US$ |
| 2012 | 41.070 US$ | 47.480 US$ |
| 2011 | 42.670 US$ | 48.200 US$ |
| 2010 | 44.970 US$ | 45.530 US$ |
| 2009 | 46.810 US$ | 44.470 US$ |
| 2008 | 50.940 US$ | 44.360 US$ |
| 2007 | 50.540 US$ | 41.130 US$ |
| 2006 | 47.950 US$ | 38.890 US$ |
| 2005 | 44.640 US$ | 36.310 US$ |
| 2004 | 37.840 US$ | 32.080 US$ |
| 2003 | 29.980 US$ | 26.470 US$ |
| 2002 | 24.920 US$ | 23.920 US$ |
| 2001 | 24.080 US$ | 24.990 US$ |
| 2000 | 24.130 US$ | 26.380 US$ |
| 1999 | 22.690 US$ | 27.020 US$ |
| 1998 | 21.430 US$ | 28.070 US$ |
| 1997 | 20.650 US$ | 30.270 US$ |
| 1996 | 18.880 US$ | 31.020 US$ |
| 1995 | 16.920 US$ | 29.650 US$ |
| 1994 | 15.480 US$ | 27.630 US$ |
| 1993 | 14.600 US$ | 26.080 US$ |
| 1992 | 14.440 US$ | 25.890 US$ |
| 1991 | 13.130 US$ | 22.950 US$ |
| 1990 | 12.560 US$ | 21.360 US$ |
| 1989 | 11.100 US$ | 19.810 US$ |
| 1988 | 10.420 US$ | 18.670 US$ |
| 1987 | 8.220 US$ | 14.280 US$ |
| 1986 | 6.370 US$ | 11.270 US$ |
| 1985 | 5.630 US$ | 9.860 US$ |
| 1984 | 5.610 US$ | 9.900 US$ |
| 1983 | 5.720 US$ | 10.050 US$ |
| 1982 | 6.390 US$ | 11.150 US$ |
| 1981 | 6.780 US$ | 12.580 US$ |
| 1980 | 6.380 US$ | 13.050 US$ |
| 1979 | 5.120 US$ | 11.090 US$ |
| 1978 | 4.120 US$ | 8.890 US$ |
| 1977 | 3.580 US$ | 7.690 US$ |
| 1976 | 3.280 US$ | 7.150 US$ |
| 1975 | 3.390 US$ | 6.740 US$ |
| 1974 | 2.990 US$ | 5.810 US$ |
| 1973 | 2.540 US$ | 4.690 US$ |
| 1972 | 2.070 US$ | 3.610 US$ |
| 1971 | 1.720 US$ | 2.980 US$ |
| 1970 | 1.520 US$ | 2.600 US$ |
| 1969 | 1.450 US$ | 2.300 US$ |
| 1968 | 1.380 US$ | 2.080 US$ |
| 1967 | 1.280 US$ | 1.910 US$ |
| 1966 | 1.170 US$ | 1.870 US$ |
| 1965 | 1.090 US$ | 1.760 US$ |
| 1964 | 1.010 US$ | 1.620 US$ |
| 1963 | 930 US$ | 1.480 US$ |
| 1962 | 860 US$ | 1.370 US$ |
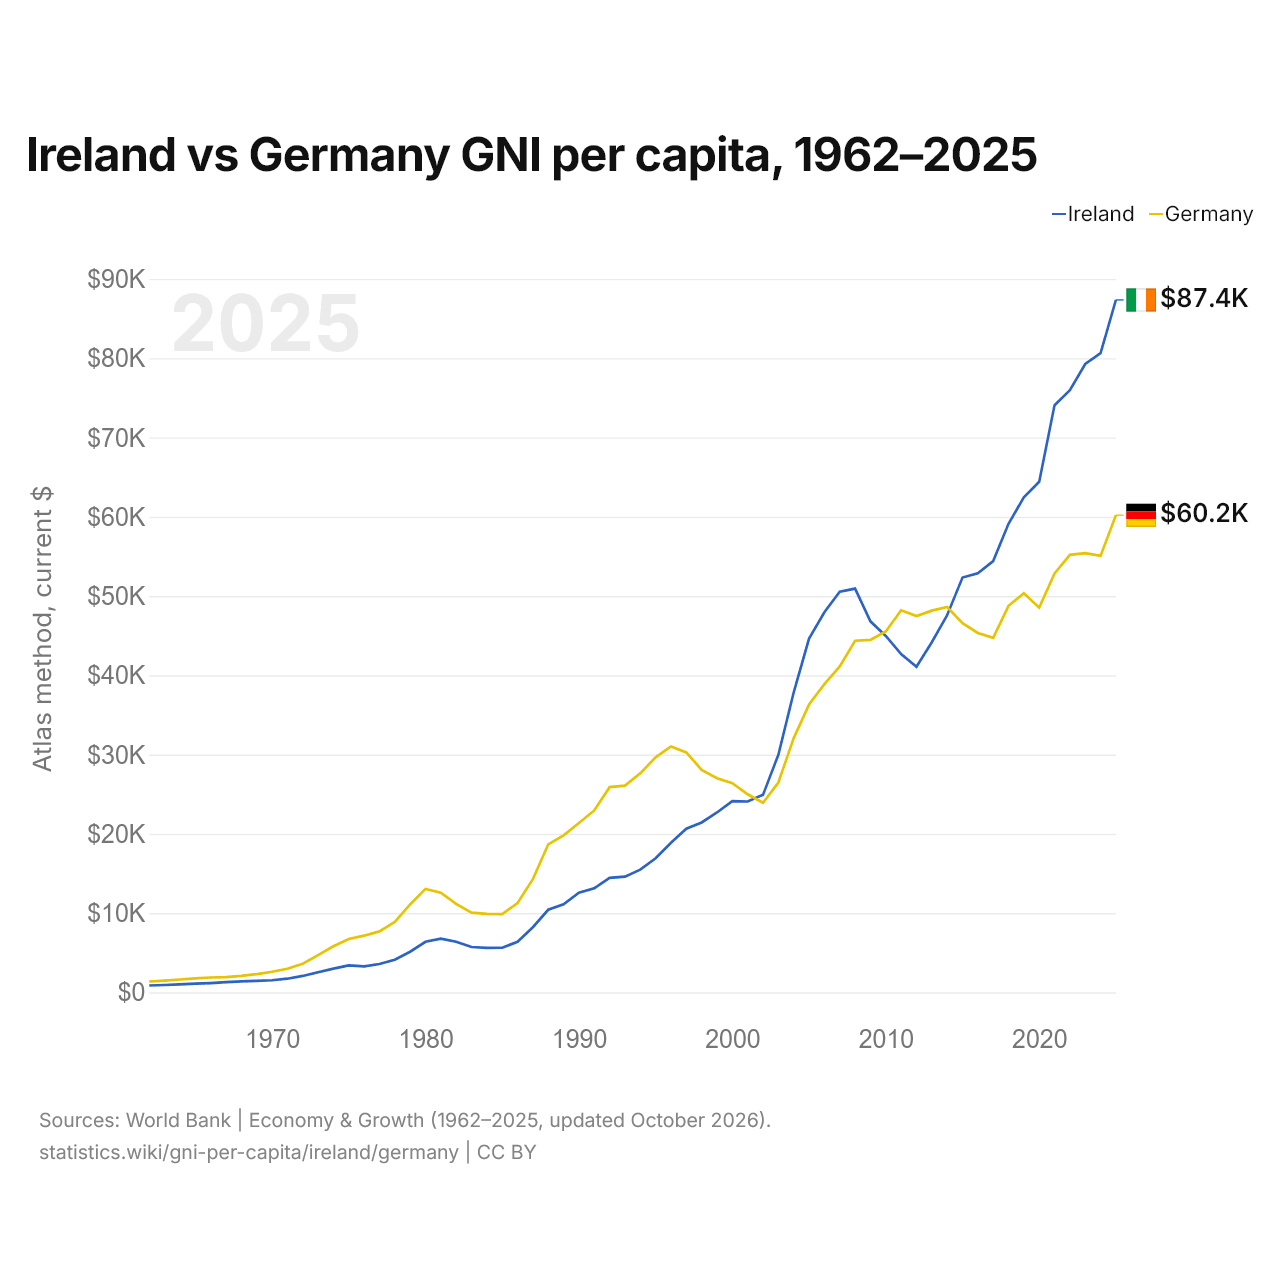
En 2025, el INB per cápita según el método Atlas fue de 87.360 US$ en Irlanda y de 60.200 US$ en Alemania: un 45 % más alto en Irlanda. En 1962 era de 860 US$ en Irlanda y de 1370 US$ en Alemania, 1,6 veces más alto en Alemania.
El INB per cápita de Irlanda ha sido más alto que el de Alemania todos los años desde 2015. Convertido según la paridad del poder adquisitivo, el INB per cápita fue de 106.310 dólares en Irlanda y de 78.140 dólares en Alemania en 2025: un 36 % más alto en Irlanda.
Irlanda vs Alemania: últimos datos del INB per cápita
|
Irlanda
|
Alemania
|
|
|---|---|---|
| Método Atlas, US$ corrientes | 87.360 US$ | 60.200 US$ |
| Puesto mundial | 7/194 | 16/194 |
| PPA, dólares internacionales | 106.310 US$ | 78.140 US$ |
| Grupo de ingreso | Ingreso alto | Ingreso alto |
| Diferencia de INB per cápita | 1,5× | 0,69× |
Comparar el INB per cápita de 2 países cualesquiera
Fuentes:
- Banco Mundial | Economía y crecimiento (1962–2025, actualizado en octubre de 2026)
Creative Commons Atribución (CC BY): puedes copiar, compartir, adaptar y reutilizar este contenido, también con fines comerciales, siempre que cites a statistics.wiki e indiques los cambios que hayas hecho. Las fuentes indicadas arriba pueden tener sus propias condiciones de licencia.