
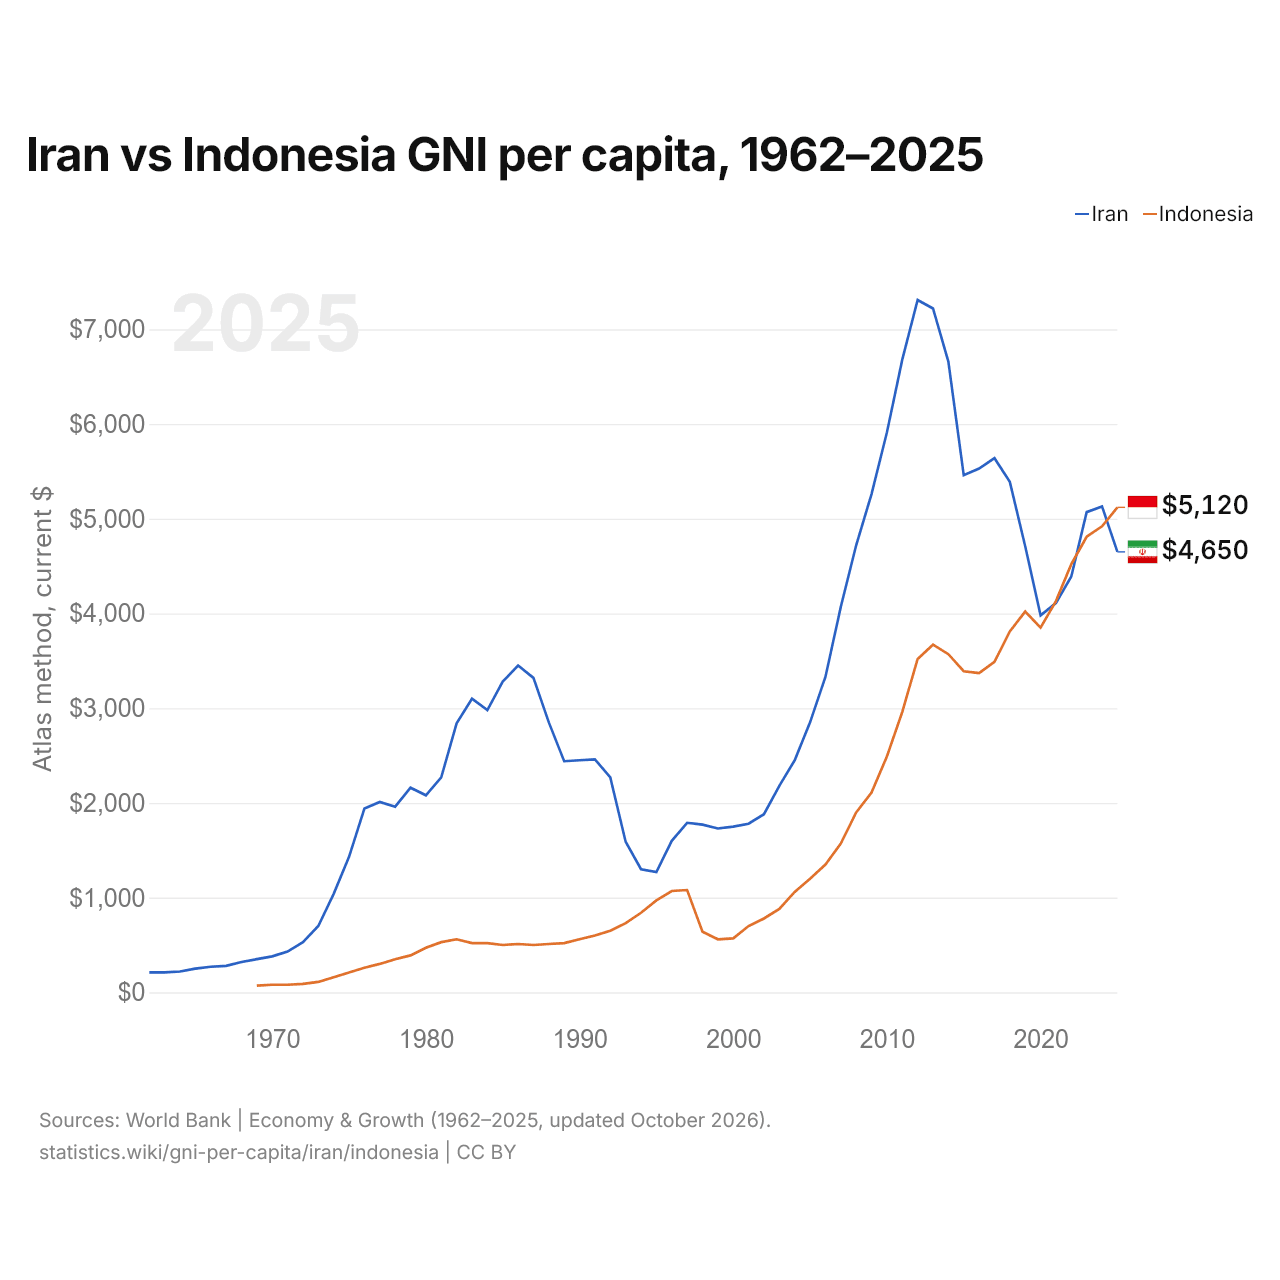
Irán vs Indonesia: INB per cápita, 1962–2025
1x
| Año | Método Atlas, US$ corrientes | |
|---|---|---|
 Irán |
 Indonesia |
|
| 2025 | 4.650 US$ | 5.120 US$ |
| 2024 | 5.130 US$ | 4.920 US$ |
| 2023 | 5.070 US$ | 4.810 US$ |
| 2022 | 4.390 US$ | 4.520 US$ |
| 2021 | 4.110 US$ | 4.130 US$ |
| 2020 | 3.980 US$ | 3.850 US$ |
| 2019 | 4.710 US$ | 4.020 US$ |
| 2018 | 5.390 US$ | 3.810 US$ |
| 2017 | 5.640 US$ | 3.490 US$ |
| 2016 | 5.530 US$ | 3.370 US$ |
| 2015 | 5.460 US$ | 3.390 US$ |
| 2014 | 6.660 US$ | 3.570 US$ |
| 2013 | 7.220 US$ | 3.670 US$ |
| 2012 | 7.310 US$ | 3.520 US$ |
| 2011 | 6.680 US$ | 2.960 US$ |
| 2010 | 5.910 US$ | 2.490 US$ |
| 2009 | 5.260 US$ | 2.110 US$ |
| 2008 | 4.720 US$ | 1.900 US$ |
| 2007 | 4.070 US$ | 1.570 US$ |
| 2006 | 3.330 US$ | 1.350 US$ |
| 2005 | 2.850 US$ | 1.200 US$ |
| 2004 | 2.450 US$ | 1.060 US$ |
| 2003 | 2.180 US$ | 880 US$ |
| 2002 | 1.880 US$ | 780 US$ |
| 2001 | 1.780 US$ | 700 US$ |
| 2000 | 1.750 US$ | 570 US$ |
| 1999 | 1.730 US$ | 560 US$ |
| 1998 | 1.770 US$ | 640 US$ |
| 1997 | 1.790 US$ | 1.080 US$ |
| 1996 | 1.600 US$ | 1.070 US$ |
| 1995 | 1.270 US$ | 970 US$ |
| 1994 | 1.300 US$ | 840 US$ |
| 1993 | 1.590 US$ | 730 US$ |
| 1992 | 2.270 US$ | 650 US$ |
| 1991 | 2.460 US$ | 600 US$ |
| 1990 | 2.450 US$ | 560 US$ |
| 1989 | 2.440 US$ | 520 US$ |
| 1988 | 2.850 US$ | 510 US$ |
| 1987 | 3.320 US$ | 500 US$ |
| 1986 | 3.450 US$ | 510 US$ |
| 1985 | 3.280 US$ | 500 US$ |
| 1984 | 2.980 US$ | 520 US$ |
| 1983 | 3.100 US$ | 520 US$ |
| 1982 | 2.840 US$ | 560 US$ |
| 1981 | 2.270 US$ | 530 US$ |
| 1980 | 2.080 US$ | 470 US$ |
| 1979 | 2.160 US$ | 390 US$ |
| 1978 | 1.960 US$ | 350 US$ |
| 1977 | 2.010 US$ | 300 US$ |
| 1976 | 1.940 US$ | 260 US$ |
| 1975 | 1.430 US$ | 210 US$ |
| 1974 | 1.040 US$ | 160 US$ |
| 1973 | 700 US$ | 110 US$ |
| 1972 | 530 US$ | 90 US$ |
| 1971 | 430 US$ | 80 US$ |
| 1970 | 380 US$ | 80 US$ |
| 1969 | 350 US$ | 70 US$ |
| 1968 | 320 US$ | - |
| 1967 | 280 US$ | - |
| 1966 | 270 US$ | - |
| 1965 | 250 US$ | - |
| 1964 | 220 US$ | - |
| 1963 | 210 US$ | - |
| 1962 | 210 US$ | - |
En 2025, el INB per cápita según el método Atlas fue de 4650 US$ en Irán y de 5120 US$ en Indonesia: un 10 % más alto en Indonesia. En 1969 era de 350 US$ en Irán y de 70 US$ en Indonesia, 5,0 veces más alto en Irán.
Convertido según la paridad del poder adquisitivo, el INB per cápita fue de 19.660 dólares en Irán y de 17.190 dólares en Indonesia en 2025: un 14 % más alto en Irán.
Irán vs Indonesia: últimos datos del INB per cápita
Comparar el INB per cápita de 2 países cualesquiera
Fuentes:
- Banco Mundial | Economía y crecimiento (1962–2025, actualizado en octubre de 2026)
Creative Commons Atribución (CC BY): puedes copiar, compartir, adaptar y reutilizar este contenido, también con fines comerciales, siempre que cites a statistics.wiki e indiques los cambios que hayas hecho. Las fuentes indicadas arriba pueden tener sus propias condiciones de licencia.