
Yemen vs Arabia Saudí: PIB, 1960–2025
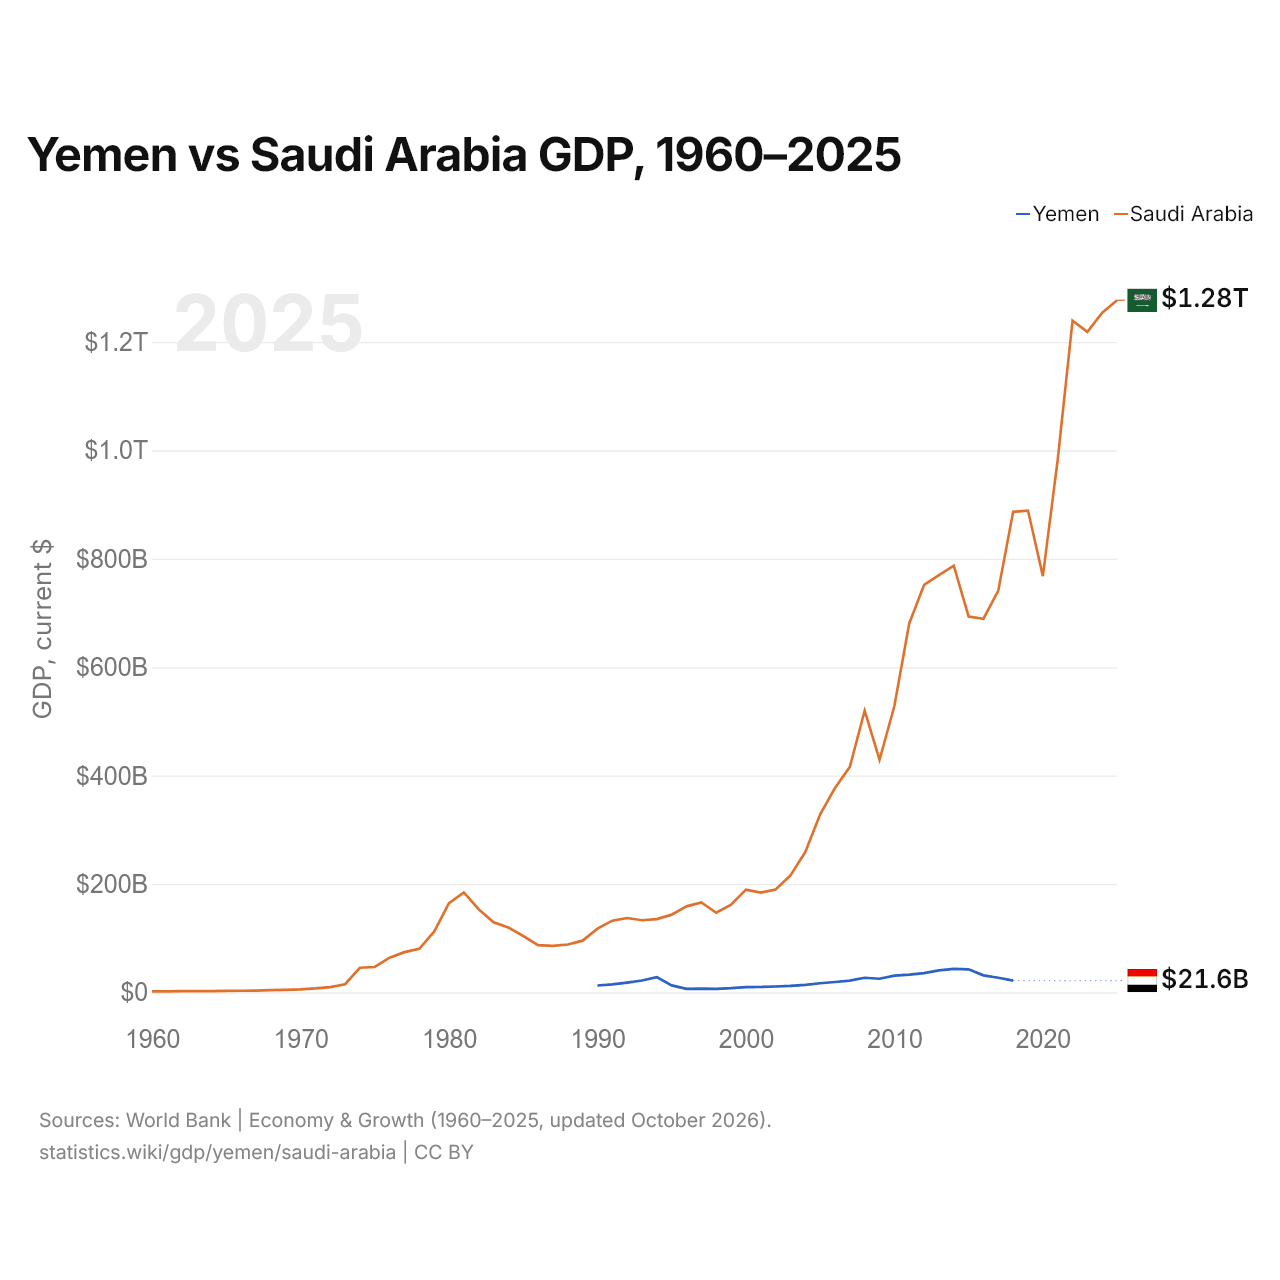
1x
| Año | PIB, US$ corrientes | |
|---|---|---|
 Yemen |
 Arabia Saudí |
|
| 2025 | - | 1.276.942.933.333 US$ |
| 2024 | - | 1.254.140.800.000 US$ |
| 2023 | - | 1.218.584.800.000 US$ |
| 2022 | - | 1.239.075.200.000 US$ |
| 2021 | - | 982.661.066.667 US$ |
| 2020 | - | 767.951.200.000 US$ |
| 2019 | - | 888.890.133.333 US$ |
| 2018 | 21.606.160.663 US$ | 886.564.800.000 US$ |
| 2017 | 26.842.229.045 US$ | 741.266.133.333 US$ |
| 2016 | 31.317.825.274 US$ | 689.279.466.667 US$ |
| 2015 | 42.444.490.074 US$ | 693.414.400.000 US$ |
| 2014 | 43.228.585.321 US$ | 787.153.066.667 US$ |
| 2013 | 40.415.233.436 US$ | 769.755.733.333 US$ |
| 2012 | 35.401.331.610 US$ | 751.921.333.333 US$ |
| 2011 | 32.726.417.878 US$ | 680.660.800.000 US$ |
| 2010 | 30.906.749.533 US$ | 528.207.466.667 US$ |
| 2009 | 25.130.278.213 US$ | 429.097.866.667 US$ |
| 2008 | 26.910.855.807 US$ | 519.796.800.000 US$ |
| 2007 | 21.650.528.674 US$ | 415.964.509.673 US$ |
| 2006 | 19.063.143.370 US$ | 376.900.133.511 US$ |
| 2005 | 16.731.566.717 US$ | 328.459.608.764 US$ |
| 2004 | 13.867.634.371 US$ | 258.742.133.333 US$ |
| 2003 | 11.777.532.662 US$ | 215.807.733.333 US$ |
| 2002 | 10.693.430.511 US$ | 189.605.866.667 US$ |
| 2001 | 9.852.990.693 US$ | 184.137.600.000 US$ |
| 2000 | 9.679.316.770 US$ | 189.514.933.333 US$ |
| 1999 | 7.639.325.296 US$ | 161.717.066.667 US$ |
| 1998 | 6.322.175.566 US$ | 146.775.466.667 US$ |
| 1997 | 6.838.298.531 US$ | 165.963.684.913 US$ |
| 1996 | 6.496.163.616 US$ | 158.662.483.311 US$ |
| 1995 | 12.796.345.679 US$ | 143.343.124.166 US$ |
| 1994 | 28.019.483.764 US$ | 135.174.899.866 US$ |
| 1993 | 21.736.802.664 US$ | 132.967.957.276 US$ |
| 1992 | 17.959.367.194 US$ | 137.087.850.467 US$ |
| 1991 | 14.665.445.462 US$ | 132.223.230.975 US$ |
| 1990 | 12.643.821.569 US$ | 117.630.173.565 US$ |
| 1989 | - | 95.344.459.279 US$ |
| 1988 | - | 88.256.074.766 US$ |
| 1987 | - | 85.695.861.148 US$ |
| 1986 | - | 86.961.922.765 US$ |
| 1985 | - | 103.897.846.494 US$ |
| 1984 | - | 119.624.858.116 US$ |
| 1983 | - | 129.171.635.311 US$ |
| 1982 | - | 153.240.313.858 US$ |
| 1981 | - | 184.291.360.139 US$ |
| 1980 | - | 164.539.660.725 US$ |
| 1979 | - | 111.858.444.786 US$ |
| 1978 | - | 80.266.516.687 US$ |
| 1977 | - | 74.188.986.586 US$ |
| 1976 | - | 64.005.665.722 US$ |
| 1975 | - | 46.773.208.643 US$ |
| 1974 | - | 45.412.957.746 US$ |
| 1973 | - | 14.947.435.499 US$ |
| 1972 | - | 9.664.267.087 US$ |
| 1971 | - | 7.184.806.909 US$ |
| 1970 | - | 5.377.333.333 US$ |
| 1969 | - | 4.485.777.644 US$ |
| 1968 | - | 4.187.777.711 US$ |
| 1967 | - | 3.257.022.223 US$ |
| 1966 | - | 2.920.555.557 US$ |
| 1965 | - | 2.647.955.558 US$ |
| 1964 | - | 2.371.808.713 US$ |
| 1963 | - | 2.207.393.172 US$ |
| 1962 | - | 2.130.606.532 US$ |
| 1961 | - | 1.920.811.284 US$ |
| 1960 | - | 1.748.124.064 US$ |
El PIB de Yemen es de 21,6 mil millones de US$ (2018), y el de Arabia Saudí, de 1,28 billones de US$ (2025).
El PIB per cápita es de 634 US$ en Yemen (2018) y de 34.537 US$ en Arabia Saudí (2025).
Yemen vs Arabia Saudí: últimos datos del PIB
|
Yemen
|
Arabia Saudí
|
|
|---|---|---|
| PIB, US$ corrientes | 21,6 mil M US$ (2018) | 1,28 B US$ (2025) |
| Puesto mundial | 130/197 | 19/197 |
| Porcentaje del mundo | 0,02 % | 1,08 % |
| PIB, US$ constantes de 2015 | 36,8 mil M US$ (2018) | 927 mil M US$ (2025) |
Comparar el PIB de 2 países cualesquiera
Fuentes:
- Banco Mundial | Economía y crecimiento (1960–2025, actualizado en octubre de 2026)
Creative Commons Atribución (CC BY): puedes copiar, compartir, adaptar y reutilizar este contenido, también con fines comerciales, siempre que cites a statistics.wiki e indiques los cambios que hayas hecho. Las fuentes indicadas arriba pueden tener sus propias condiciones de licencia.