
Estados Unidos vs Islandia: PIB, 1960–2025
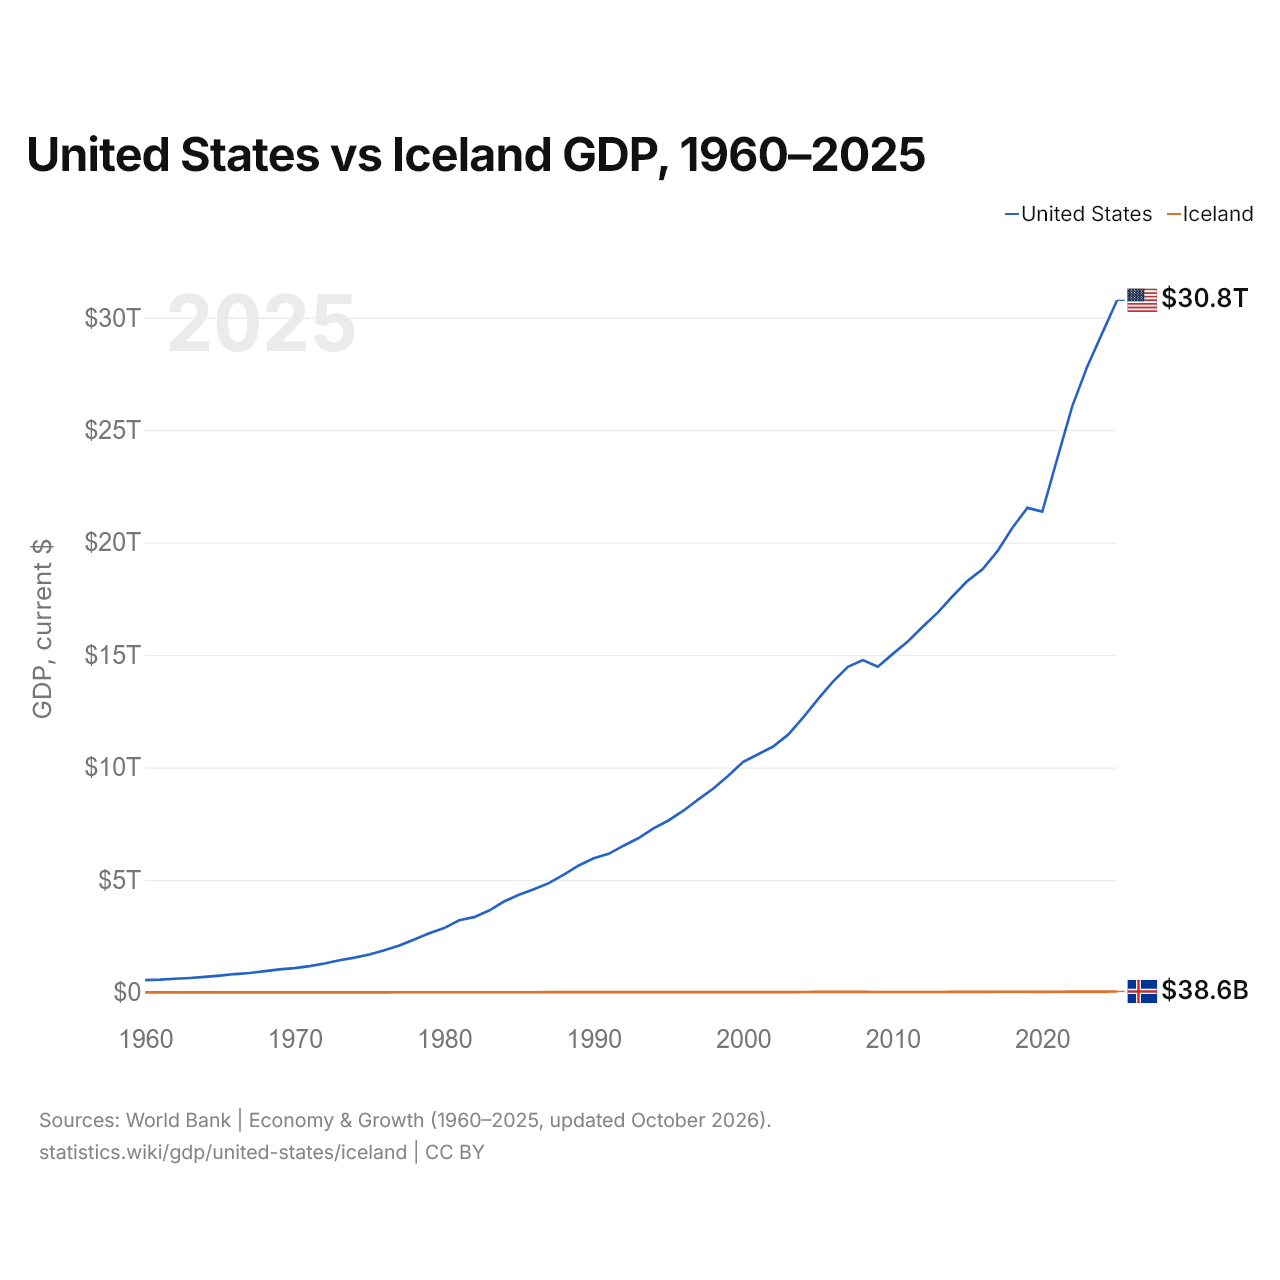
| Año | PIB, US$ corrientes | |
|---|---|---|
 Estados Unidos |
 Islandia |
|
| 2025 | 30.769.700.000.000 US$ | 38.582.528.789 US$ |
| 2024 | 29.298.013.000.000 US$ | 33.186.621.855 US$ |
| 2023 | 27.811.517.000.000 US$ | 31.701.996.434 US$ |
| 2022 | 26.054.614.000.000 US$ | 29.176.227.825 US$ |
| 2021 | 23.725.645.000.000 US$ | 26.234.872.402 US$ |
| 2020 | 21.375.281.000.000 US$ | 22.034.665.041 US$ |
| 2019 | 21.539.982.000.000 US$ | 24.985.687.022 US$ |
| 2018 | 20.656.516.000.000 US$ | 26.677.652.544 US$ |
| 2017 | 19.612.102.000.000 US$ | 25.060.086.488 US$ |
| 2016 | 18.804.913.000.000 US$ | 21.083.713.310 US$ |
| 2015 | 18.295.019.000.000 US$ | 17.700.486.957 US$ |
| 2014 | 17.608.138.000.000 US$ | 18.052.183.515 US$ |
| 2013 | 16.880.683.000.000 US$ | 16.244.319.959 US$ |
| 2012 | 16.253.970.000.000 US$ | 14.943.757.823 US$ |
| 2011 | 15.599.732.000.000 US$ | 15.394.005.872 US$ |
| 2010 | 15.048.971.000.000 US$ | 13.922.711.577 US$ |
| 2009 | 14.478.067.000.000 US$ | 13.212.543.838 US$ |
| 2008 | 14.769.862.000.000 US$ | 18.247.921.360 US$ |
| 2007 | 14.474.228.000.000 US$ | 21.960.110.030 US$ |
| 2006 | 13.815.583.000.000 US$ | 17.671.649.843 US$ |
| 2005 | 13.039.197.000.000 US$ | 17.146.410.561 US$ |
| 2004 | 12.217.196.000.000 US$ | 13.963.943.244 US$ |
| 2003 | 11.456.450.000.000 US$ | 11.564.687.742 US$ |
| 2002 | 10.929.108.000.000 US$ | 9.416.199.700 US$ |
| 2001 | 10.581.929.000.000 US$ | 8.323.401.820 US$ |
| 2000 | 10.250.952.000.000 US$ | 9.140.168.922 US$ |
| 1999 | 9.631.172.000.000 US$ | 9.107.644.691 US$ |
| 1998 | 9.062.817.000.000 US$ | 8.637.732.542 US$ |
| 1997 | 8.577.552.000.000 US$ | 7.716.781.803 US$ |
| 1996 | 8.073.122.000.000 US$ | 7.686.566.105 US$ |
| 1995 | 7.639.749.000.000 US$ | 7.372.640.169 US$ |
| 1994 | 7.287.236.000.000 US$ | 6.612.804.056 US$ |
| 1993 | 6.858.559.000.000 US$ | 6.435.952.174 US$ |
| 1992 | 6.520.327.000.000 US$ | 7.328.497.599 US$ |
| 1991 | 6.158.129.000.000 US$ | 7.151.260.062 US$ |
| 1990 | 5.963.144.000.000 US$ | 6.694.851.159 US$ |
| 1989 | 5.641.580.000.000 US$ | 5.870.854.233 US$ |
| 1988 | 5.236.438.000.000 US$ | 6.320.093.411 US$ |
| 1987 | 4.855.215.000.000 US$ | 5.713.281.235 US$ |
| 1986 | 4.579.631.000.000 US$ | 4.129.080.094 US$ |
| 1985 | 4.338.979.000.000 US$ | 3.088.359.967 US$ |
| 1984 | 4.037.613.000.000 US$ | 2.964.568.006 US$ |
| 1983 | 3.634.038.000.000 US$ | 2.862.634.164 US$ |
| 1982 | 3.343.789.000.000 US$ | 3.318.714.326 US$ |
| 1981 | 3.207.041.000.000 US$ | 3.615.094.820 US$ |
| 1980 | 2.857.307.000.000 US$ | 3.499.616.683 US$ |
| 1979 | 2.627.333.000.000 US$ | 2.953.176.971 US$ |
| 1978 | 2.351.599.000.000 US$ | 2.599.627.089 US$ |
| 1977 | 2.081.826.000.000 US$ | 2.285.707.749 US$ |
| 1976 | 1.873.412.000.000 US$ | 1.727.845.419 US$ |
| 1975 | 1.684.904.000.000 US$ | 1.456.052.700 US$ |
| 1974 | 1.545.243.000.000 US$ | 1.568.154.077 US$ |
| 1973 | 1.425.376.000.000 US$ | 1.194.794.186 US$ |
| 1972 | 1.279.110.000.000 US$ | 869.002.946 US$ |
| 1971 | 1.164.850.000.000 US$ | 693.679.545 US$ |
| 1970 | 1.073.303.000.000 US$ | 545.115.909 US$ |
| 1969 | 1.017.438.172.414 US$ | 435.659.610 US$ |
| 1968 | 940.225.000.000 US$ | 498.365.200 US$ |
| 1967 | 859.620.034.483 US$ | 652.609.076 US$ |
| 1966 | 813.032.758.621 US$ | 660.663.763 US$ |
| 1965 | 741.904.862.069 US$ | 550.150.988 US$ |
| 1964 | 684.144.620.690 US$ | 456.206.299 US$ |
| 1963 | 637.058.551.724 US$ | 357.240.896 US$ |
| 1962 | 603.639.413.793 US$ | 299.309.938 US$ |
| 1961 | 561.940.310.345 US$ | 266.711.460 US$ |
| 1960 | 541.988.586.207 US$ | 260.984.499 US$ |
En 2025, el PIB de Estados Unidos (30,8 billones de US$) fue 800 veces el de Islandia (38,6 mil millones de US$). En 2015 era 1000 veces. De 2015 a 2025, a precios constantes de 2015, el PIB de Estados Unidos creció un 26,9 % y el de Islandia, un 30,6 %.
Desde 1960, el PIB de Estados Unidos ha sido cada año el mayor de los dos; en 1960, era 2100 veces el de Islandia. En 2025, el PIB per cápita fue de 90.027 US$ en Estados Unidos y de 98.323 US$ en Islandia: un 9,2 % más alto en Islandia.
Estados Unidos vs Islandia: últimos datos del PIB
|
Estados Unidos
|
Islandia
|
|
|---|---|---|
| PIB, US$ corrientes | 30,8 B US$ | 38,6 mil M US$ |
| Puesto mundial | 1/197 | 105/197 |
| Porcentaje del mundo | 26 % | 0,03 % |
| PIB, US$ constantes de 2015 | 23,2 B US$ | 23,1 mil M US$ |
| Diferencia de PIB | 798× | 0,0013× |
Comparar el PIB de 2 países cualesquiera
Fuentes:
- Banco Mundial | Economía y crecimiento (1960–2025, actualizado en octubre de 2026)
Creative Commons Atribución (CC BY): puedes copiar, compartir, adaptar y reutilizar este contenido, también con fines comerciales, siempre que cites a statistics.wiki e indiques los cambios que hayas hecho. Las fuentes indicadas arriba pueden tener sus propias condiciones de licencia.