
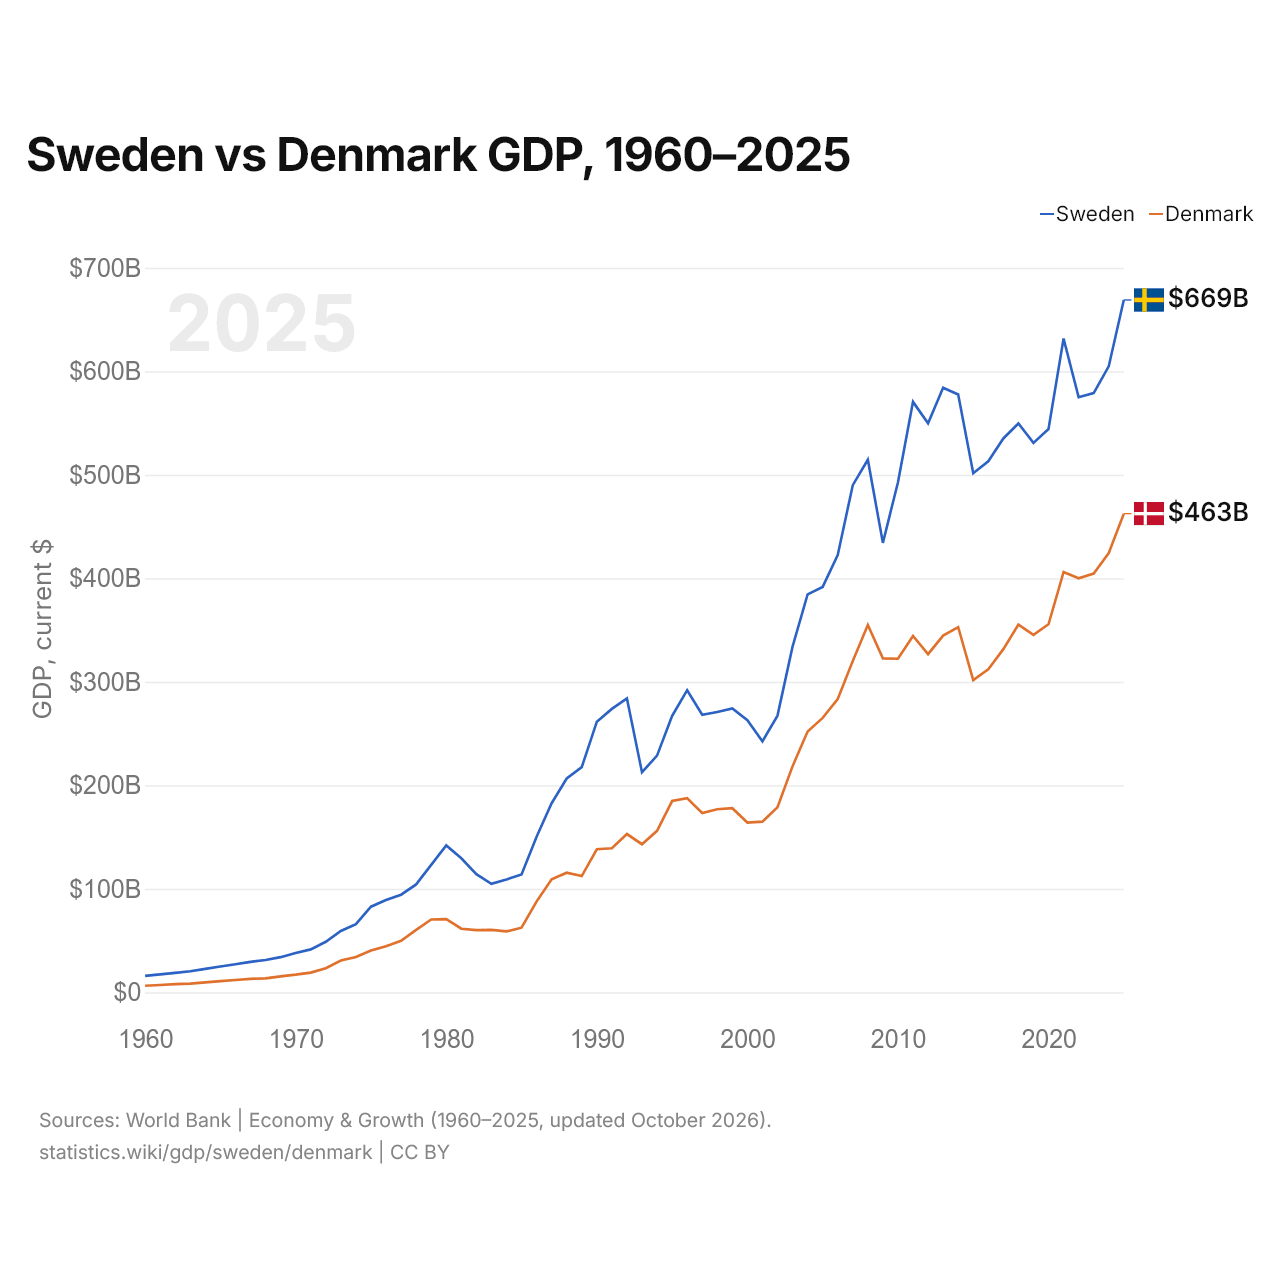
Suecia vs Dinamarca: PIB, 1960–2025
| Año | PIB, US$ corrientes | |
|---|---|---|
 Suecia |
 Dinamarca |
|
| 2025 | 668.998.664.082 US$ | 462.526.660.468 US$ |
| 2024 | 604.827.393.489 US$ | 424.524.722.037 US$ |
| 2023 | 578.990.915.246 US$ | 404.651.706.118 US$ |
| 2022 | 575.071.237.641 US$ | 400.114.306.337 US$ |
| 2021 | 631.693.331.301 US$ | 406.110.162.088 US$ |
| 2020 | 544.265.668.452 US$ | 355.631.021.932 US$ |
| 2019 | 530.894.124.494 US$ | 345.401.473.013 US$ |
| 2018 | 549.649.344.043 US$ | 355.293.374.912 US$ |
| 2017 | 535.172.356.785 US$ | 331.610.593.962 US$ |
| 2016 | 513.058.312.951 US$ | 312.181.849.372 US$ |
| 2015 | 501.602.351.912 US$ | 301.758.922.338 US$ |
| 2014 | 577.727.767.304 US$ | 352.832.602.064 US$ |
| 2013 | 584.125.353.119 US$ | 344.631.016.965 US$ |
| 2012 | 549.739.674.655 US$ | 326.792.574.245 US$ |
| 2011 | 570.538.581.144 US$ | 344.315.595.263 US$ |
| 2010 | 492.750.897.239 US$ | 322.345.594.075 US$ |
| 2009 | 434.311.714.442 US$ | 322.619.152.195 US$ |
| 2008 | 514.614.100.833 US$ | 354.979.471.960 US$ |
| 2007 | 490.047.789.548 US$ | 320.213.157.595 US$ |
| 2006 | 422.528.394.459 US$ | 283.386.151.544 US$ |
| 2005 | 391.688.455.929 US$ | 265.150.087.712 US$ |
| 2004 | 384.545.442.175 US$ | 251.986.155.631 US$ |
| 2003 | 334.072.443.516 US$ | 218.421.193.436 US$ |
| 2002 | 267.371.907.447 US$ | 178.788.209.558 US$ |
| 2001 | 242.497.797.485 US$ | 164.881.594.415 US$ |
| 2000 | 262.903.560.280 US$ | 164.043.817.224 US$ |
| 1999 | 274.318.357.862 US$ | 177.887.720.536 US$ |
| 1998 | 270.887.306.759 US$ | 176.877.077.513 US$ |
| 1997 | 268.249.616.891 US$ | 173.241.365.735 US$ |
| 1996 | 291.949.597.375 US$ | 187.481.157.846 US$ |
| 1995 | 267.050.453.507 US$ | 184.848.481.008 US$ |
| 1994 | 228.699.066.874 US$ | 156.017.919.221 US$ |
| 1993 | 212.644.602.616 US$ | 143.111.306.004 US$ |
| 1992 | 283.908.914.454 US$ | 152.966.494.260 US$ |
| 1991 | 273.831.464.572 US$ | 139.180.507.778 US$ |
| 1990 | 261.466.577.009 US$ | 138.217.740.684 US$ |
| 1989 | 217.632.340.195 US$ | 112.312.200.761 US$ |
| 1988 | 206.686.590.776 US$ | 115.540.189.705 US$ |
| 1987 | 182.744.315.974 US$ | 109.183.446.340 US$ |
| 1986 | 150.279.869.729 US$ | 87.748.695.217 US$ |
| 1985 | 113.958.084.357 US$ | 62.452.421.011 US$ |
| 1984 | 109.043.045.407 US$ | 58.868.891.335 US$ |
| 1983 | 104.862.109.663 US$ | 60.331.158.447 US$ |
| 1982 | 114.214.731.799 US$ | 60.084.214.872 US$ |
| 1981 | 129.498.921.476 US$ | 61.459.941.461 US$ |
| 1980 | 141.886.067.004 US$ | 70.811.287.816 US$ |
| 1979 | 123.207.527.699 US$ | 70.393.030.603 US$ |
| 1978 | 104.290.933.496 US$ | 60.320.089.218 US$ |
| 1977 | 94.331.782.622 US$ | 49.711.709.588 US$ |
| 1976 | 89.232.517.046 US$ | 44.503.607.444 US$ |
| 1975 | 82.765.232.648 US$ | 40.418.967.666 US$ |
| 1974 | 65.917.634.590 US$ | 34.125.712.481 US$ |
| 1973 | 59.318.842.992 US$ | 30.718.181.337 US$ |
| 1972 | 48.883.173.400 US$ | 23.230.667.549 US$ |
| 1971 | 41.506.151.115 US$ | 19.086.192.720 US$ |
| 1970 | 38.037.226.668 US$ | 17.075.457.733 US$ |
| 1969 | 33.967.301.561 US$ | 15.414.902.667 US$ |
| 1968 | 31.277.871.669 US$ | 13.505.574.133 US$ |
| 1967 | 29.474.881.506 US$ | 13.059.064.806 US$ |
| 1966 | 27.154.716.721 US$ | 11.931.740.293 US$ |
| 1965 | 24.963.947.415 US$ | 10.870.670.865 US$ |
| 1964 | 22.685.490.195 US$ | 9.677.401.337 US$ |
| 1963 | 20.342.131.882 US$ | 8.466.044.980 US$ |
| 1962 | 18.794.066.990 US$ | 7.953.274.741 US$ |
| 1961 | 17.329.620.585 US$ | 7.058.361.229 US$ |
| 1960 | 15.930.075.467 US$ | 6.361.166.545 US$ |
En 2025, el PIB de Suecia (669 mil millones de US$) fue un 45 % mayor que el de Dinamarca (463 mil millones de US$). En 2015 era 1,7 veces. De 2015 a 2025, a precios constantes de 2015, el PIB de Suecia creció un 16,2 % y el de Dinamarca, un 23,9 %.
Desde 1960, el PIB de Suecia ha sido cada año el mayor de los dos; en 1960, era 2,5 veces el de Dinamarca. En 2025, el PIB per cápita fue de 63.133 US$ en Suecia y de 76.970 US$ en Dinamarca: un 22 % más alto en Dinamarca.
Suecia vs Dinamarca: últimos datos del PIB
|
Suecia
|
Dinamarca
|
|
|---|---|---|
| PIB, US$ corrientes | 669 mil M US$ | 463 mil M US$ |
| Puesto mundial | 26/197 | 36/197 |
| Porcentaje del mundo | 0,57 % | 0,39 % |
| PIB, US$ constantes de 2015 | 583 mil M US$ | 374 mil M US$ |
| Diferencia de PIB | 1,4× | 0,69× |
Comparar el PIB de 2 países cualesquiera
Fuentes:
- Banco Mundial | Economía y crecimiento (1960–2025, actualizado en octubre de 2026)
Creative Commons Atribución (CC BY): puedes copiar, compartir, adaptar y reutilizar este contenido, también con fines comerciales, siempre que cites a statistics.wiki e indiques los cambios que hayas hecho. Las fuentes indicadas arriba pueden tener sus propias condiciones de licencia.