
Serbia vs Grecia: PIB, 1960–2025
| Año | PIB, US$ corrientes | |
|---|---|---|
 Serbia |
 Grecia |
|
| 2025 | 99.953.324.473 US$ | 280.635.521.324 US$ |
| 2024 | 90.088.366.320 US$ | 256.238.371.778 US$ |
| 2023 | 81.343.999.280 US$ | 242.946.187.738 US$ |
| 2022 | 66.809.895.701 US$ | 217.990.189.601 US$ |
| 2021 | 66.159.884.073 US$ | 218.303.801.895 US$ |
| 2020 | 55.874.017.669 US$ | 191.362.985.555 US$ |
| 2019 | 53.864.693.665 US$ | 207.305.649.887 US$ |
| 2018 | 52.787.520.249 US$ | 213.298.873.494 US$ |
| 2017 | 45.972.834.714 US$ | 200.381.103.984 US$ |
| 2016 | 42.225.495.910 US$ | 193.097.239.006 US$ |
| 2015 | 41.297.410.635 US$ | 194.567.373.678 US$ |
| 2014 | 49.114.321.280 US$ | 233.911.581.521 US$ |
| 2013 | 50.455.529.604 US$ | 236.556.279.641 US$ |
| 2012 | 45.103.269.969 US$ | 238.841.140.018 US$ |
| 2011 | 51.251.098.408 US$ | 283.228.079.776 US$ |
| 2010 | 43.536.629.233 US$ | 296.417.644.404 US$ |
| 2009 | 46.955.984.410 US$ | 326.829.054.686 US$ |
| 2008 | 54.220.641.202 US$ | 351.121.399.546 US$ |
| 2007 | 44.888.028.946 US$ | 314.226.996.944 US$ |
| 2006 | 33.298.057.362 US$ | 269.073.415.334 US$ |
| 2005 | 28.334.256.181 US$ | 242.315.668.619 US$ |
| 2004 | 26.845.632.342 US$ | 234.979.615.898 US$ |
| 2003 | 23.593.044.418 US$ | 196.930.509.813 US$ |
| 2002 | 17.930.583.571 US$ | 150.253.800.086 US$ |
| 2001 | 13.599.378.662 US$ | 132.050.474.720 US$ |
| 2000 | 7.326.373.882 US$ | 125.760.166.225 US$ |
| 1999 | 20.878.694.851 US$ | 137.131.371.955 US$ |
| 1998 | 21.004.077.441 US$ | 139.612.812.176 US$ |
| 1997 | 27.153.408.995 US$ | 138.766.067.640 US$ |
| 1996 | 23.277.430.168 US$ | 142.502.984.145 US$ |
| 1995 | 17.921.892.655 US$ | 134.974.613.914 US$ |
| 1994 | - | 114.980.063.202 US$ |
| 1993 | - | 107.295.704.518 US$ |
| 1992 | - | 114.608.178.405 US$ |
| 1991 | - | 103.680.863.713 US$ |
| 1990 | - | 96.529.587.274 US$ |
| 1989 | - | 78.067.933.277 US$ |
| 1988 | - | 75.200.610.137 US$ |
| 1987 | - | 64.739.630.096 US$ |
| 1986 | - | 55.595.445.472 US$ |
| 1985 | - | 47.155.741.426 US$ |
| 1984 | - | 47.352.146.312 US$ |
| 1983 | - | 48.741.397.059 US$ |
| 1982 | - | 53.858.346.939 US$ |
| 1981 | - | 51.618.456.335 US$ |
| 1980 | - | 56.039.256.595 US$ |
| 1979 | - | 53.724.121.435 US$ |
| 1978 | - | 43.654.480.519 US$ |
| 1977 | - | 35.673.080.481 US$ |
| 1976 | - | 30.719.552.239 US$ |
| 1975 | - | 28.129.128.587 US$ |
| 1974 | - | 24.998.715.909 US$ |
| 1973 | - | 22.037.019.563 US$ |
| 1972 | - | 16.650.659.091 US$ |
| 1971 | - | 14.388.806.818 US$ |
| 1970 | - | 12.957.113.636 US$ |
| 1969 | - | 11.454.106.327 US$ |
| 1968 | - | 9.950.331.206 US$ |
| 1967 | - | 9.146.592.856 US$ |
| 1966 | - | 8.472.021.467 US$ |
| 1965 | - | 7.582.209.670 US$ |
| 1964 | - | 6.576.906.345 US$ |
| 1963 | - | 5.813.285.627 US$ |
| 1962 | - | 5.140.542.929 US$ |
| 1961 | - | 4.892.397.431 US$ |
| 1960 | - | 4.274.890.307 US$ |
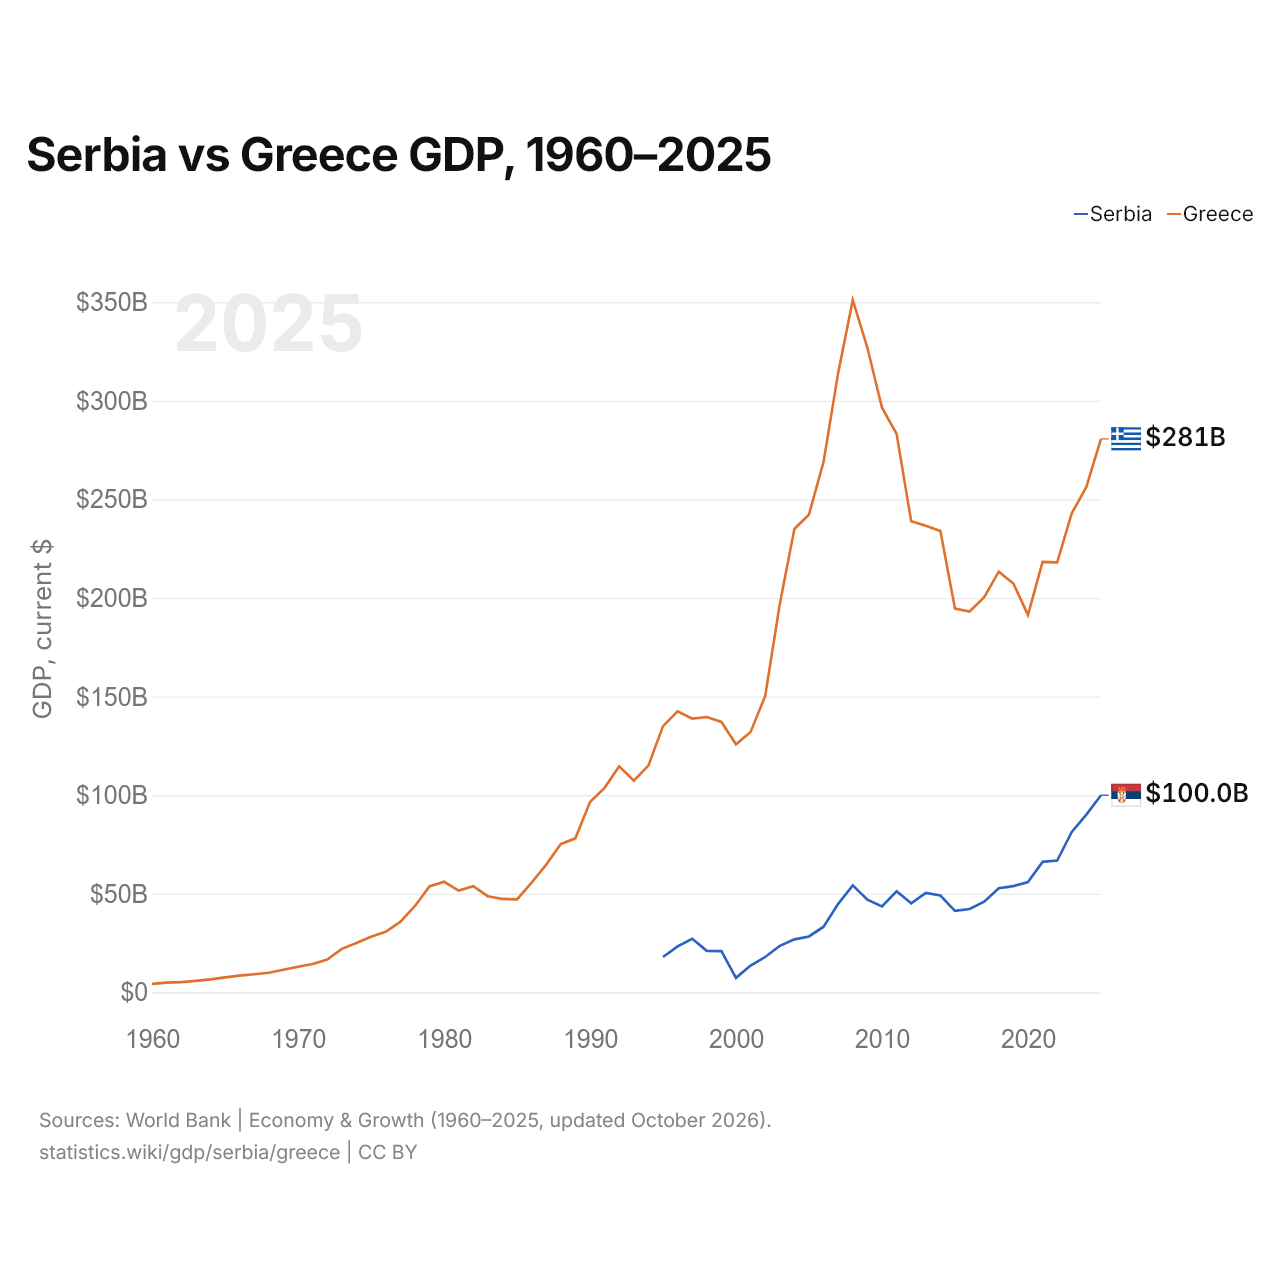
En 2025, el PIB de Grecia (281 mil millones de US$) fue 2,8 veces el de Serbia (100 mil millones de US$). En 2015 era 4,7 veces. De 2015 a 2025, a precios constantes de 2015, el PIB de Grecia creció un 17,3 % y el de Serbia, un 39,6 %.
Desde 1995, el PIB de Grecia ha sido cada año el mayor de los dos; en 1995, era 7,5 veces el de Serbia. En 2025, el PIB per cápita fue de 15.262 US$ en Serbia y de 26.948 US$ en Grecia: 1,8 veces más alto en Grecia.
Serbia vs Grecia: últimos datos del PIB
|
Serbia
|
Grecia
|
|
|---|---|---|
| PIB, US$ corrientes | 100 mil M US$ | 281 mil M US$ |
| Puesto mundial | 76/197 | 52/197 |
| Porcentaje del mundo | 0,08 % | 0,24 % |
| PIB, US$ constantes de 2015 | 57,7 mil M US$ | 228 mil M US$ |
| Diferencia de PIB | 0,36× | 2,8× |
Comparar el PIB de 2 países cualesquiera
Fuentes:
- Banco Mundial | Economía y crecimiento (1960–2025, actualizado en octubre de 2026)
Creative Commons Atribución (CC BY): puedes copiar, compartir, adaptar y reutilizar este contenido, también con fines comerciales, siempre que cites a statistics.wiki e indiques los cambios que hayas hecho. Las fuentes indicadas arriba pueden tener sus propias condiciones de licencia.