
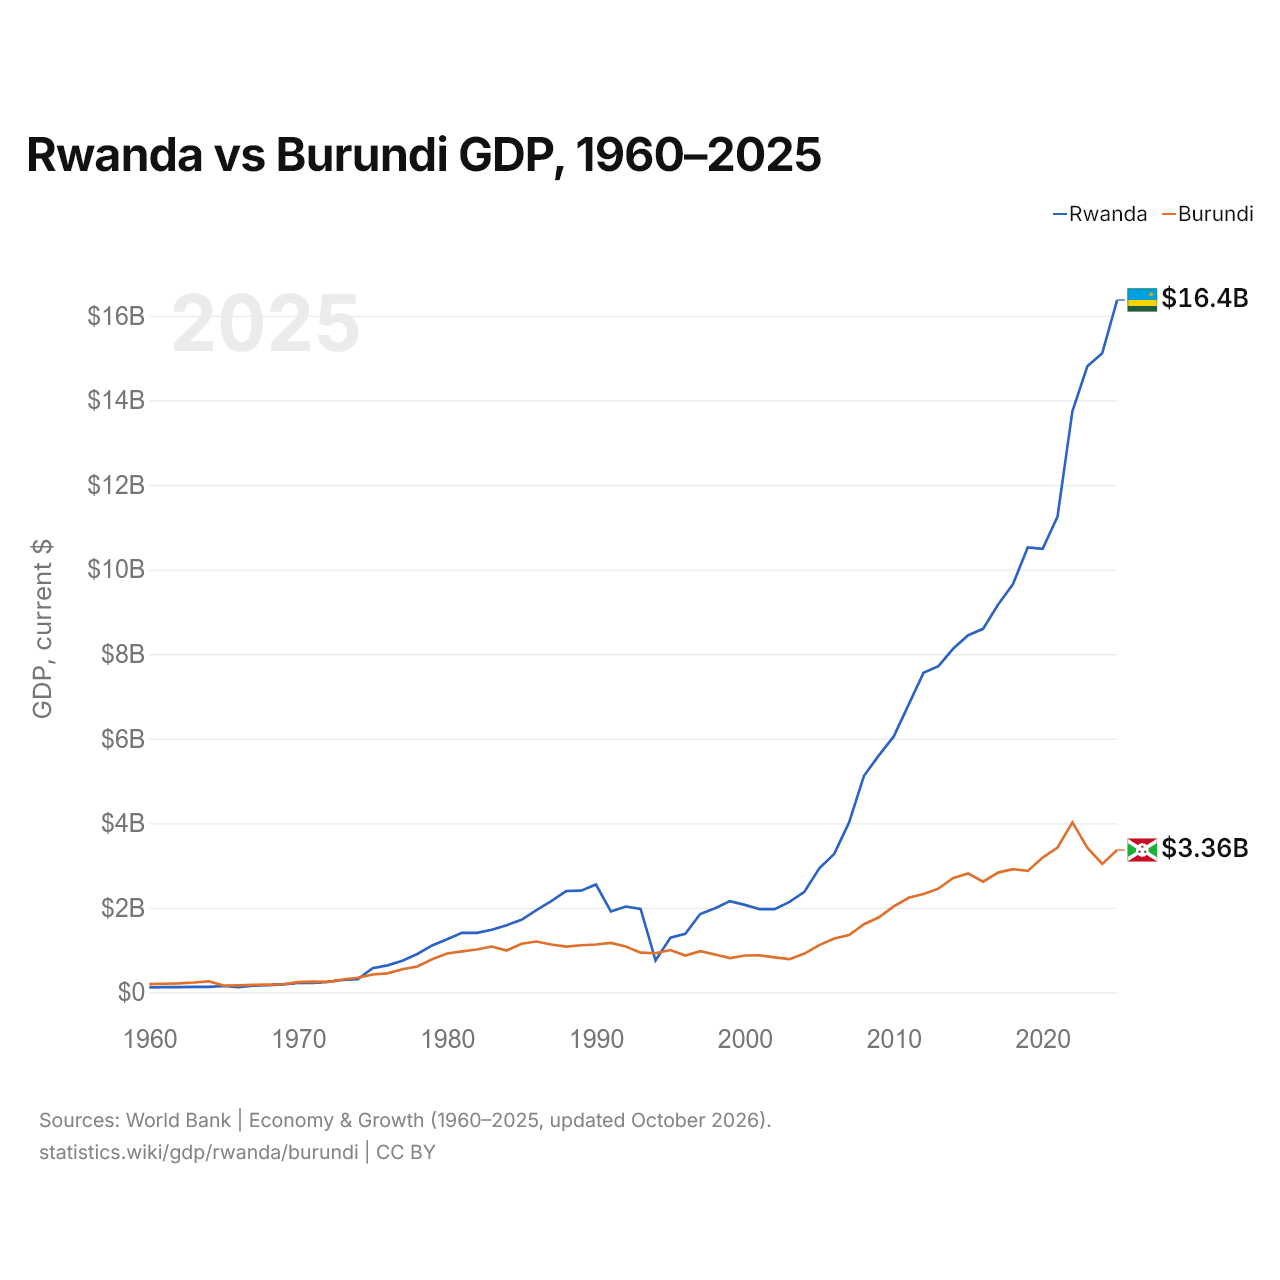
Ruanda vs Burundi: PIB, 1960–2025
| Año | PIB, US$ corrientes | |
|---|---|---|
 Ruanda |
 Burundi |
|
| 2025 | 16.372.132.990 US$ | 3.364.713.864 US$ |
| 2024 | 15.111.064.182 US$ | 3.037.579.858 US$ |
| 2023 | 14.806.501.437 US$ | 3.419.558.408 US$ |
| 2022 | 13.747.404.814 US$ | 4.020.736.757 US$ |
| 2021 | 11.252.894.910 US$ | 3.425.127.991 US$ |
| 2020 | 10.487.146.253 US$ | 3.188.355.944 US$ |
| 2019 | 10.519.272.170 US$ | 2.871.555.326 US$ |
| 2018 | 9.650.161.136 US$ | 2.913.411.408 US$ |
| 2017 | 9.164.345.443 US$ | 2.831.362.208 US$ |
| 2016 | 8.596.812.241 US$ | 2.618.093.125 US$ |
| 2015 | 8.447.064.079 US$ | 2.810.532.912 US$ |
| 2014 | 8.129.984.484 US$ | 2.705.826.648 US$ |
| 2013 | 7.714.276.920 US$ | 2.451.624.638 US$ |
| 2012 | 7.556.673.276 US$ | 2.327.402.363 US$ |
| 2011 | 6.802.676.034 US$ | 2.235.812.880 US$ |
| 2010 | 6.052.276.078 US$ | 2.032.135.192 US$ |
| 2009 | 5.603.399.015 US$ | 1.775.495.032 US$ |
| 2008 | 5.120.655.375 US$ | 1.611.835.857 US$ |
| 2007 | 4.017.977.507 US$ | 1.356.199.387 US$ |
| 2006 | 3.274.207.945 US$ | 1.273.375.078 US$ |
| 2005 | 2.933.819.766 US$ | 1.117.113.080 US$ |
| 2004 | 2.376.496.067 US$ | 915.257.323 US$ |
| 2003 | 2.138.237.279 US$ | 784.654.424 US$ |
| 2002 | 1.966.003.468 US$ | 825.394.519 US$ |
| 2001 | 1.966.600.715 US$ | 876.794.723 US$ |
| 2000 | 2.068.836.754 US$ | 870.486.066 US$ |
| 1999 | 2.157.108.263 US$ | 808.077.223 US$ |
| 1998 | 1.989.343.546 US$ | 893.770.740 US$ |
| 1997 | 1.851.558.197 US$ | 972.896.268 US$ |
| 1996 | 1.382.334.879 US$ | 869.033.856 US$ |
| 1995 | 1.293.535.193 US$ | 1.000.428.394 US$ |
| 1994 | 753.636.370 US$ | 925.030.590 US$ |
| 1993 | 1.971.525.712 US$ | 938.632.612 US$ |
| 1992 | 2.029.026.962 US$ | 1.083.037.671 US$ |
| 1991 | 1.911.600.237 US$ | 1.167.398.478 US$ |
| 1990 | 2.550.185.679 US$ | 1.132.101.253 US$ |
| 1989 | 2.405.022.593 US$ | 1.113.924.130 US$ |
| 1988 | 2.395.492.687 US$ | 1.082.403.219 US$ |
| 1987 | 2.157.432.668 US$ | 1.131.466.494 US$ |
| 1986 | 1.944.710.684 US$ | 1.201.725.497 US$ |
| 1985 | 1.715.626.331 US$ | 1.149.979.286 US$ |
| 1984 | 1.587.413.084 US$ | 987.143.931 US$ |
| 1983 | 1.479.687.587 US$ | 1.082.926.304 US$ |
| 1982 | 1.407.243.139 US$ | 1.013.222.222 US$ |
| 1981 | 1.407.062.527 US$ | 969.046.667 US$ |
| 1980 | 1.254.765.642 US$ | 919.726.667 US$ |
| 1979 | 1.109.346.131 US$ | 782.496.667 US$ |
| 1978 | 905.709.076 US$ | 610.225.556 US$ |
| 1977 | 746.650.613 US$ | 547.535.556 US$ |
| 1976 | 637.753.853 US$ | 448.412.754 US$ |
| 1975 | 571.863.500 US$ | 420.986.667 US$ |
| 1974 | 308.458.423 US$ | 345.263.492 US$ |
| 1973 | 290.746.157 US$ | 304.339.524 US$ |
| 1972 | 246.457.838 US$ | 246.804.571 US$ |
| 1971 | 222.952.504 US$ | 252.842.286 US$ |
| 1970 | 219.900.006 US$ | 242.732.571 US$ |
| 1969 | 188.700.037 US$ | 190.205.714 US$ |
| 1968 | 172.200.018 US$ | 183.200.000 US$ |
| 1967 | 159.560.018 US$ | 178.297.143 US$ |
| 1966 | 124.525.703 US$ | 165.444.571 US$ |
| 1965 | 148.799.980 US$ | 158.994.963 US$ |
| 1964 | 129.999.994 US$ | 260.750.008 US$ |
| 1963 | 128.000.000 US$ | 232.749.998 US$ |
| 1962 | 125.000.008 US$ | 213.500.006 US$ |
| 1961 | 122.000.016 US$ | 202.999.992 US$ |
| 1960 | 119.000.024 US$ | 195.999.990 US$ |
En 2025, el PIB de Ruanda (16,4 mil millones de US$) fue 4,9 veces el de Burundi (3,36 mil millones de US$). En 2015 era 3,0 veces. De 2015 a 2025, a precios constantes de 2015, el PIB de Ruanda creció un 92,6 % y el de Burundi, un 40,0 %.
Desde 1995, el PIB de Ruanda es el mayor de los dos; en 1960, el de Burundi era 1,6 veces el de Ruanda. En 2025, el PIB per cápita fue de 1124 US$ en Ruanda y de 234 US$ en Burundi: 4,8 veces más alto en Ruanda.
Ruanda vs Burundi: últimos datos del PIB
|
Ruanda
|
Burundi
|
|
|---|---|---|
| PIB, US$ corrientes | 16,4 mil M US$ | 3360 M US$ |
| Puesto mundial | 142/197 | 169/197 |
| Porcentaje del mundo | 0,01 % | 0,003 % |
| PIB, US$ constantes de 2015 | 16,3 mil M US$ | 3930 M US$ |
| Diferencia de PIB | 4,9× | 0,21× |
Comparar el PIB de 2 países cualesquiera
Fuentes:
- Banco Mundial | Economía y crecimiento (1960–2025, actualizado en octubre de 2026)
Creative Commons Atribución (CC BY): puedes copiar, compartir, adaptar y reutilizar este contenido, también con fines comerciales, siempre que cites a statistics.wiki e indiques los cambios que hayas hecho. Las fuentes indicadas arriba pueden tener sus propias condiciones de licencia.