
Polonia vs Japón: PIB, 1960–2025
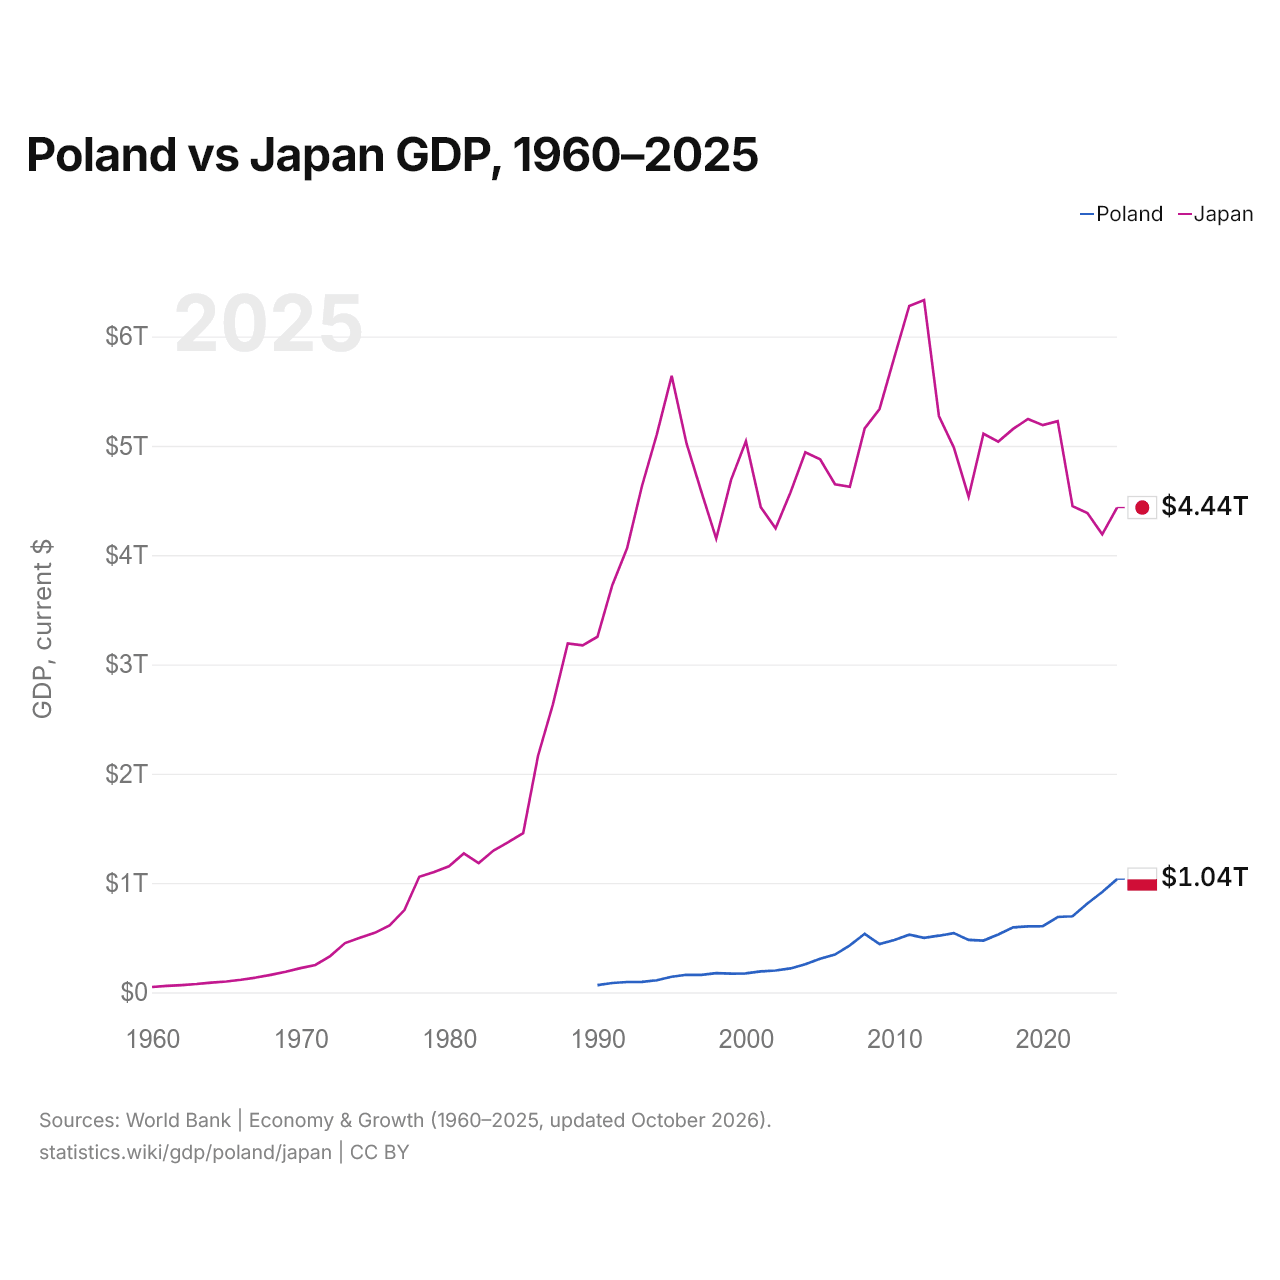
| Año | PIB, US$ corrientes | |
|---|---|---|
 Polonia |
 Japón |
|
| 2025 | 1.035.491.784.197 US$ | 4.435.162.999.977 US$ |
| 2024 | 917.767.106.147 US$ | 4.190.008.188.359 US$ |
| 2023 | 812.451.193.396 US$ | 4.384.854.269.962 US$ |
| 2022 | 695.607.470.875 US$ | 4.447.976.207.315 US$ |
| 2021 | 689.170.230.665 US$ | 5.225.933.520.753 US$ |
| 2020 | 605.914.237.904 US$ | 5.189.197.543.645 US$ |
| 2019 | 602.683.770.145 US$ | 5.245.755.000.479 US$ |
| 2018 | 594.616.632.477 US$ | 5.154.293.721.630 US$ |
| 2017 | 528.356.723.263 US$ | 5.038.231.631.661 US$ |
| 2016 | 473.259.623.976 US$ | 5.110.357.383.254 US$ |
| 2015 | 480.054.118.583 US$ | 4.534.438.580.495 US$ |
| 2014 | 542.134.167.179 US$ | 4.985.763.289.561 US$ |
| 2013 | 518.179.836.405 US$ | 5.272.297.037.397 US$ |
| 2012 | 498.148.649.703 US$ | 6.333.803.928.788 US$ |
| 2011 | 527.848.543.023 US$ | 6.279.422.550.219 US$ |
| 2010 | 478.111.630.684 US$ | 5.811.578.109.447 US$ |
| 2009 | 440.891.472.247 US$ | 5.336.765.697.589 US$ |
| 2008 | 535.612.030.672 US$ | 5.160.197.175.876 US$ |
| 2007 | 429.715.132.138 US$ | 4.624.670.179.655 US$ |
| 2006 | 345.897.630.736 US$ | 4.648.058.930.707 US$ |
| 2005 | 306.999.913.151 US$ | 4.875.648.486.366 US$ |
| 2004 | 256.268.656.145 US$ | 4.941.485.123.807 US$ |
| 2003 | 218.561.225.998 US$ | 4.573.413.206.709 US$ |
| 2002 | 199.694.463.256 US$ | 4.245.946.980.572 US$ |
| 2001 | 191.823.200.371 US$ | 4.438.792.748.062 US$ |
| 2000 | 172.953.527.033 US$ | 5.042.381.838.343 US$ |
| 1999 | 170.704.452.715 US$ | 4.688.983.449.627 US$ |
| 1998 | 175.282.269.667 US$ | 4.150.359.076.370 US$ |
| 1997 | 159.893.964.917 US$ | 4.579.780.793.432 US$ |
| 1996 | 160.813.026.223 US$ | 5.021.441.618.840 US$ |
| 1995 | 142.838.527.115 US$ | 5.639.649.753.986 US$ |
| 1994 | 110.803.635.288 US$ | 5.104.063.486.348 US$ |
| 1993 | 96.043.157.273 US$ | 4.632.480.515.091 US$ |
| 1992 | 94.337.050.693 US$ | 4.064.529.567.505 US$ |
| 1991 | 85.500.935.935 US$ | 3.724.887.648.862 US$ |
| 1990 | 65.977.748.211 US$ | 3.252.994.239.867 US$ |
| 1989 | - | 3.174.934.735.896 US$ |
| 1988 | - | 3.191.546.727.316 US$ |
| 1987 | - | 2.635.094.473.494 US$ |
| 1986 | - | 2.164.729.071.349 US$ |
| 1985 | - | 1.457.070.301.468 US$ |
| 1984 | - | 1.374.165.212.365 US$ |
| 1983 | - | 1.297.622.008.229 US$ |
| 1982 | - | 1.183.132.285.328 US$ |
| 1981 | - | 1.271.443.597.067 US$ |
| 1980 | - | 1.153.159.955.513 US$ |
| 1979 | - | 1.100.608.979.757 US$ |
| 1978 | - | 1.057.419.758.047 US$ |
| 1977 | - | 752.590.681.822 US$ |
| 1976 | - | 611.495.350.304 US$ |
| 1975 | - | 544.082.569.364 US$ |
| 1974 | - | 500.355.087.138 US$ |
| 1973 | - | 450.756.970.744 US$ |
| 1972 | - | 331.776.379.992 US$ |
| 1971 | - | 250.530.994.765 US$ |
| 1970 | - | 221.798.003.144 US$ |
| 1969 | - | 188.179.852.753 US$ |
| 1968 | - | 160.201.483.788 US$ |
| 1967 | - | 135.265.319.098 US$ |
| 1966 | - | 115.427.351.851 US$ |
| 1965 | - | 99.387.878.008 US$ |
| 1964 | - | 89.332.989.729 US$ |
| 1963 | - | 75.945.582.324 US$ |
| 1962 | - | 66.356.388.224 US$ |
| 1961 | - | 58.472.696.006 US$ |
| 1960 | - | 48.417.804.545 US$ |
En 2025, el PIB de Japón (4,44 billones de US$) fue 4,3 veces el de Polonia (1,04 billones de US$). En 2015 era 9,4 veces. De 2015 a 2025, a precios constantes de 2015, el PIB de Japón creció un 5,1 % y el de Polonia, un 42,0 %.
Desde 1990, el PIB de Japón ha sido cada año el mayor de los dos; en 1990, era 49 veces el de Polonia. En 2025, el PIB per cápita fue de 28.420 US$ en Polonia y de 35.951 US$ en Japón: un 27 % más alto en Japón.
Polonia vs Japón: últimos datos del PIB
|
Polonia
|
Japón
|
|
|---|---|---|
| PIB, US$ corrientes | 1,04 B US$ | 4,44 B US$ |
| Puesto mundial | 21/197 | 4/197 |
| Porcentaje del mundo | 0,87 % | 3,75 % |
| PIB, US$ constantes de 2015 | 682 mil M US$ | 4,76 B US$ |
| Diferencia de PIB | 0,23× | 4,3× |
Comparar el PIB de 2 países cualesquiera
Fuentes:
- Banco Mundial | Economía y crecimiento (1960–2025, actualizado en octubre de 2026)
Creative Commons Atribución (CC BY): puedes copiar, compartir, adaptar y reutilizar este contenido, también con fines comerciales, siempre que cites a statistics.wiki e indiques los cambios que hayas hecho. Las fuentes indicadas arriba pueden tener sus propias condiciones de licencia.