
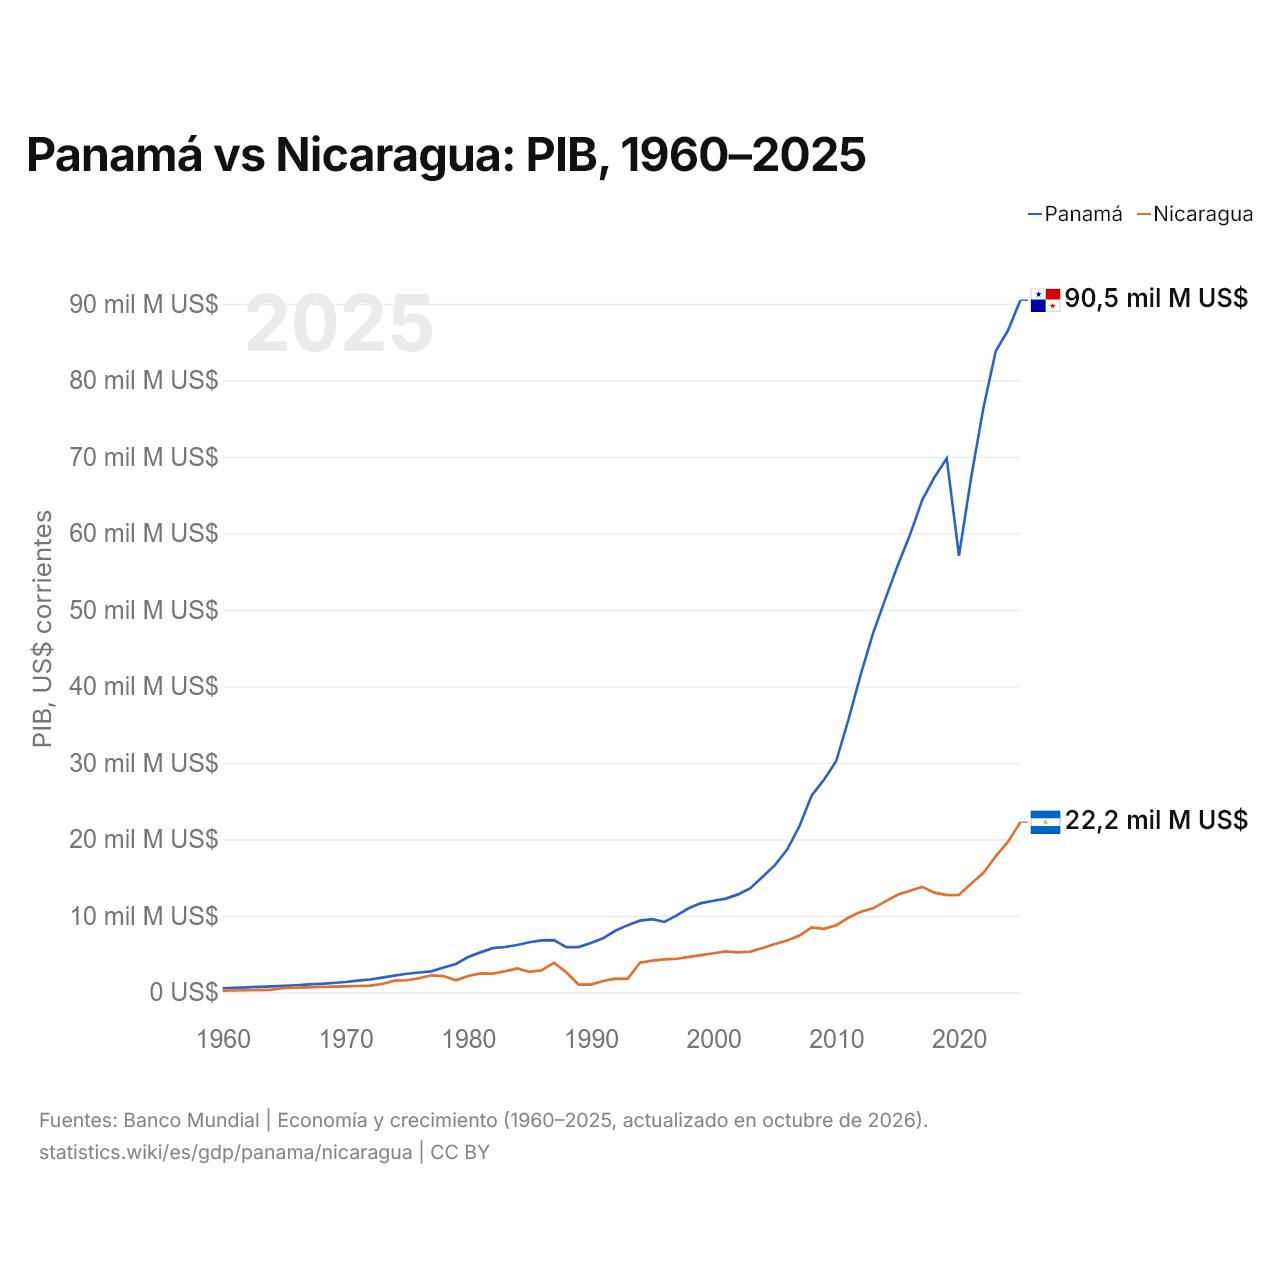
Panamá vs Nicaragua: PIB, 1960–2025
| Año | PIB, US$ corrientes | |
|---|---|---|
 Panamá |
 Nicaragua |
|
| 2025 | 90.462.600.000 US$ | 22.237.167.113 US$ |
| 2024 | 86.523.959.100 US$ | 19.696.311.850 US$ |
| 2023 | 83.812.155.200 US$ | 17.805.842.221 US$ |
| 2022 | 76.479.304.500 US$ | 15.634.573.556 US$ |
| 2021 | 67.396.392.500 US$ | 14.209.019.392 US$ |
| 2020 | 57.059.846.500 US$ | 12.726.422.432 US$ |
| 2019 | 69.778.991.200 US$ | 12.699.023.614 US$ |
| 2018 | 67.316.471.200 US$ | 13.025.221.974 US$ |
| 2017 | 64.327.688.800 US$ | 13.785.893.007 US$ |
| 2016 | 59.760.858.700 US$ | 13.286.093.388 US$ |
| 2015 | 55.767.806.100 US$ | 12.756.696.261 US$ |
| 2014 | 51.427.104.900 US$ | 11.880.438.824 US$ |
| 2013 | 46.949.496.500 US$ | 10.982.988.249 US$ |
| 2012 | 41.595.439.700 US$ | 10.532.017.232 US$ |
| 2011 | 35.687.738.300 US$ | 9.774.329.333 US$ |
| 2010 | 30.231.009.500 US$ | 8.758.602.233 US$ |
| 2009 | 27.791.215.500 US$ | 8.298.702.489 US$ |
| 2008 | 25.721.328.000 US$ | 8.496.967.597 US$ |
| 2007 | 21.717.433.800 US$ | 7.423.375.015 US$ |
| 2006 | 18.659.721.500 US$ | 6.763.672.381 US$ |
| 2005 | 16.623.906.700 US$ | 6.321.324.279 US$ |
| 2004 | 15.100.203.400 US$ | 5.792.932.838 US$ |
| 2003 | 13.603.456.000 US$ | 5.322.228.351 US$ |
| 2002 | 12.800.851.300 US$ | 5.223.727.303 US$ |
| 2001 | 12.252.906.300 US$ | 5.351.752.034 US$ |
| 2000 | 11.966.497.000 US$ | 5.109.587.050 US$ |
| 1999 | 11.660.704.800 US$ | 4.856.026.259 US$ |
| 1998 | 11.019.557.700 US$ | 4.635.347.386 US$ |
| 1997 | 10.058.854.400 US$ | 4.389.973.490 US$ |
| 1996 | 9.197.503.300 US$ | 4.308.351.903 US$ |
| 1995 | 9.573.813.700 US$ | 4.140.470.000 US$ |
| 1994 | 9.365.289.800 US$ | 3.863.185.119 US$ |
| 1993 | 8.782.585.400 US$ | 1.756.454.248 US$ |
| 1992 | 8.042.337.700 US$ | 1.792.800.000 US$ |
| 1991 | 7.074.675.500 US$ | 1.488.804.124 US$ |
| 1990 | 6.433.967.000 US$ | 1.009.455.484 US$ |
| 1989 | 5.918.469.800 US$ | 1.013.184.756 US$ |
| 1988 | 5.902.783.400 US$ | 2.630.900.096 US$ |
| 1987 | 6.827.665.300 US$ | 3.851.200.118 US$ |
| 1986 | 6.797.834.200 US$ | 2.885.799.994 US$ |
| 1985 | 6.541.517.100 US$ | 2.683.699.935 US$ |
| 1984 | 6.183.387.100 US$ | 3.117.599.872 US$ |
| 1983 | 5.923.755.900 US$ | 2.753.100.058 US$ |
| 1982 | 5.769.767.900 US$ | 2.454.499.872 US$ |
| 1981 | 5.222.421.500 US$ | 2.474.700.227 US$ |
| 1980 | 4.614.086.400 US$ | 2.144.300.006 US$ |
| 1979 | 3.704.551.600 US$ | 1.567.599.982 US$ |
| 1978 | 3.244.558.600 US$ | 2.127.699.979 US$ |
| 1977 | 2.738.261.900 US$ | 2.226.999.874 US$ |
| 1976 | 2.588.106.000 US$ | 1.836.899.999 US$ |
| 1975 | 2.435.304.100 US$ | 1.581.599.959 US$ |
| 1974 | 2.188.307.600 US$ | 1.521.400.012 US$ |
| 1973 | 1.913.793.400 US$ | 1.092.900.015 US$ |
| 1972 | 1.673.411.700 US$ | 878.570.045 US$ |
| 1971 | 1.523.917.200 US$ | 828.569.953 US$ |
| 1970 | 1.351.006.400 US$ | 778.569.939 US$ |
| 1969 | 1.221.305.700 US$ | 750.000.003 US$ |
| 1968 | 1.112.791.100 US$ | 692.859.985 US$ |
| 1967 | 1.034.376.400 US$ | 657.140.011 US$ |
| 1966 | 928.833.000 US$ | 607.140.010 US$ |
| 1965 | 852.485.300 US$ | 564.290.020 US$ |
| 1964 | 776.137.500 US$ | 347.119.918 US$ |
| 1963 | 722.784.500 US$ | 297.324.163 US$ |
| 1962 | 652.120.900 US$ | 269.283.804 US$ |
| 1961 | 599.026.300 US$ | 244.144.237 US$ |
| 1960 | 537.147.100 US$ | 227.223.322 US$ |
En 2025, el PIB de Panamá (90,5 mil millones de US$) fue 4,1 veces el de Nicaragua (22,2 mil millones de US$). En 2015 era 4,4 veces. De 2015 a 2025, a precios constantes de 2015, el PIB de Panamá creció un 44,7 % y el de Nicaragua, un 30,3 %.
Desde 1960, el PIB de Panamá ha sido cada año el mayor de los dos; en 1960, era 2,4 veces el de Nicaragua. En 2025, el PIB per cápita fue de 19.790 US$ en Panamá y de 3173 US$ en Nicaragua: 6,2 veces más alto en Panamá.
Panamá vs Nicaragua: últimos datos del PIB
|
Panamá
|
Nicaragua
|
|
|---|---|---|
| PIB, US$ corrientes | 90,5 mil M US$ | 22,2 mil M US$ |
| Puesto mundial | 82/197 | 128/197 |
| Porcentaje del mundo | 0,08 % | 0,02 % |
| PIB, US$ constantes de 2015 | 80,7 mil M US$ | 16,6 mil M US$ |
| Diferencia de PIB | 4,1× | 0,25× |
Comparar el PIB de 2 países cualesquiera
Fuentes:
- Banco Mundial | Economía y crecimiento (1960–2025, actualizado en octubre de 2026)
Creative Commons Atribución (CC BY): puedes copiar, compartir, adaptar y reutilizar este contenido, también con fines comerciales, siempre que cites a statistics.wiki e indiques los cambios que hayas hecho. Las fuentes indicadas arriba pueden tener sus propias condiciones de licencia.