
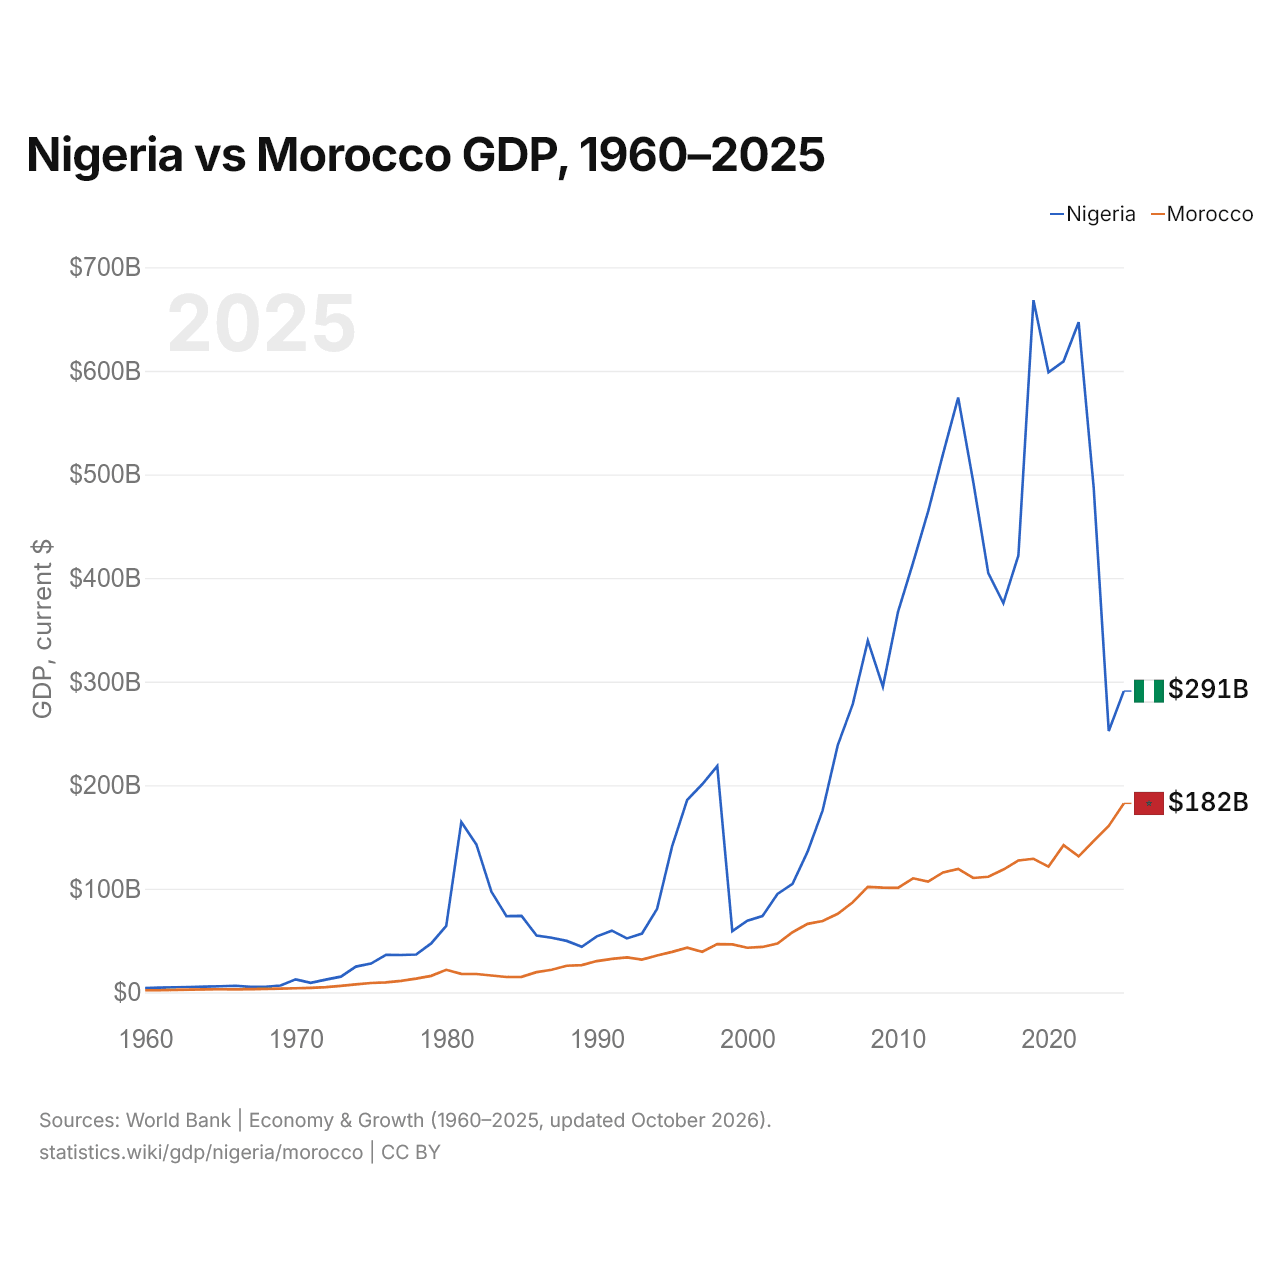
Nigeria vs Marruecos: PIB, 1960–2025
| Año | PIB, US$ corrientes | |
|---|---|---|
 Nigeria |
 Marruecos |
|
| 2025 | 290.794.361.542 US$ | 182.374.250.612 US$ |
| 2024 | 252.261.880.140 US$ | 160.610.994.055 US$ |
| 2023 | 487.387.801.878 US$ | 146.036.093.667 US$ |
| 2022 | 646.950.257.575 US$ | 131.245.312.804 US$ |
| 2021 | 609.147.716.965 US$ | 142.022.058.447 US$ |
| 2020 | 598.586.817.817 US$ | 121.353.645.057 US$ |
| 2019 | 668.219.992.687 US$ | 128.920.266.409 US$ |
| 2018 | 421.739.251.509 US$ | 127.341.147.582 US$ |
| 2017 | 375.745.731.053 US$ | 118.540.573.368 US$ |
| 2016 | 404.649.125.252 US$ | 111.572.947.005 US$ |
| 2015 | 493.026.682.801 US$ | 110.413.823.842 US$ |
| 2014 | 574.183.763.412 US$ | 119.130.841.412 US$ |
| 2013 | 520.117.180.314 US$ | 115.739.287.305 US$ |
| 2012 | 463.971.018.239 US$ | 106.937.392.311 US$ |
| 2011 | 414.466.676.831 US$ | 110.080.631.332 US$ |
| 2010 | 366.990.417.129 US$ | 100.865.329.473 US$ |
| 2009 | 295.008.835.381 US$ | 101.154.952.241 US$ |
| 2008 | 339.476.276.258 US$ | 101.822.906.949 US$ |
| 2007 | 278.260.846.800 US$ | 86.947.913.287 US$ |
| 2006 | 238.454.997.161 US$ | 75.883.823.301 US$ |
| 2005 | 175.670.569.969 US$ | 68.852.658.069 US$ |
| 2004 | 135.764.731.646 US$ | 66.114.145.451 US$ |
| 2003 | 104.738.954.264 US$ | 58.029.363.354 US$ |
| 2002 | 95.054.059.303 US$ | 47.077.192.188 US$ |
| 2001 | 73.557.840.064 US$ | 43.831.480.208 US$ |
| 2000 | 69.171.451.627 US$ | 43.017.455.402 US$ |
| 1999 | 59.145.077.039 US$ | 46.266.428.648 US$ |
| 1998 | 218.416.200.673 US$ | 46.497.608.725 US$ |
| 1997 | 200.850.397.618 US$ | 39.147.844.526 US$ |
| 1996 | 185.730.236.700 US$ | 43.161.571.528 US$ |
| 1995 | 140.919.776.986 US$ | 39.030.285.468 US$ |
| 1994 | 80.399.613.064 US$ | 35.604.137.423 US$ |
| 1993 | 56.721.051.402 US$ | 31.655.473.664 US$ |
| 1992 | 52.058.181.854 US$ | 33.711.069.431 US$ |
| 1991 | 59.526.833.412 US$ | 32.285.573.574 US$ |
| 1990 | 54.035.795.388 US$ | 30.179.954.775 US$ |
| 1989 | 44.003.061.108 US$ | 26.314.313.191 US$ |
| 1988 | 49.648.470.440 US$ | 25.705.296.184 US$ |
| 1987 | 52.676.041.931 US$ | 21.765.195.948 US$ |
| 1986 | 54.805.852.581 US$ | 19.462.085.540 US$ |
| 1985 | 73.745.821.158 US$ | 14.991.283.216 US$ |
| 1984 | 73.484.359.521 US$ | 14.824.667.954 US$ |
| 1983 | 97.094.911.792 US$ | 16.251.408.128 US$ |
| 1982 | 142.769.363.314 US$ | 17.692.276.734 US$ |
| 1981 | 164.475.209.516 US$ | 17.788.185.479 US$ |
| 1980 | 64.201.788.123 US$ | 21.728.516.153 US$ |
| 1979 | 47.259.911.894 US$ | 15.911.994.817 US$ |
| 1978 | 36.527.862.209 US$ | 13.236.946.234 US$ |
| 1977 | 36.035.407.725 US$ | 11.049.783.872 US$ |
| 1976 | 36.308.883.249 US$ | 9.584.297.284 US$ |
| 1975 | 27.778.934.625 US$ | 8.984.853.005 US$ |
| 1974 | 24.846.641.318 US$ | 7.675.466.449 US$ |
| 1973 | 15.162.871.287 US$ | 6.242.145.880 US$ |
| 1972 | 12.274.416.018 US$ | 5.074.117.545 US$ |
| 1971 | 9.181.769.912 US$ | 4.356.669.034 US$ |
| 1970 | 12.546.094.982 US$ | 3.956.336.244 US$ |
| 1969 | 6.634.317.346 US$ | 3.651.622.669 US$ |
| 1968 | 5.200.997.920 US$ | 3.271.422.333 US$ |
| 1967 | 5.203.237.919 US$ | 3.046.345.314 US$ |
| 1966 | 6.366.917.453 US$ | 2.876.401.297 US$ |
| 1965 | 5.874.537.650 US$ | 2.948.331.090 US$ |
| 1964 | 5.552.931.319 US$ | 2.798.345.299 US$ |
| 1963 | 5.165.590.254 US$ | 2.657.252.578 US$ |
| 1962 | 4.909.399.176 US$ | 2.379.611.125 US$ |
| 1961 | 4.467.287.893 US$ | 2.025.693.540 US$ |
| 1960 | 4.196.174.502 US$ | 2.037.154.742 US$ |
En 2025, el PIB de Nigeria (291 mil millones de US$) fue 1,6 veces el de Marruecos (182 mil millones de US$). En 2015 era 4,5 veces. De 2015 a 2025, a precios constantes de 2015, el PIB de Nigeria creció un 14,1 % y el de Marruecos, un 28,8 %.
Desde 1960, el PIB de Nigeria ha sido cada año el mayor de los dos; en 1960, era 2,1 veces el de Marruecos. En 2025, el PIB per cápita fue de 1224 US$ en Nigeria y de 4746 US$ en Marruecos: 3,9 veces más alto en Marruecos.
Nigeria vs Marruecos: últimos datos del PIB
|
Nigeria
|
Marruecos
|
|
|---|---|---|
| PIB, US$ corrientes | 291 mil M US$ | 182 mil M US$ |
| Puesto mundial | 50/197 | 58/197 |
| Porcentaje del mundo | 0,25 % | 0,15 % |
| PIB, US$ constantes de 2015 | 563 mil M US$ | 142 mil M US$ |
| Diferencia de PIB | 1,6× | 0,63× |
Comparar el PIB de 2 países cualesquiera
Fuentes:
- Banco Mundial | Economía y crecimiento (1960–2025, actualizado en octubre de 2026)
Creative Commons Atribución (CC BY): puedes copiar, compartir, adaptar y reutilizar este contenido, también con fines comerciales, siempre que cites a statistics.wiki e indiques los cambios que hayas hecho. Las fuentes indicadas arriba pueden tener sus propias condiciones de licencia.