
Jamaica vs Bahamas: PIB, 1960–2025
| Año | PIB, US$ corrientes | |
|---|---|---|
 Jamaica |
 Bahamas |
|
| 2025 | 22.704.903.218 US$ | - |
| 2024 | 22.014.429.051 US$ | 15.832.800.000 US$ |
| 2023 | 21.418.797.833 US$ | 15.271.300.000 US$ |
| 2022 | 18.813.516.805 US$ | 13.896.800.000 US$ |
| 2021 | 15.963.885.376 US$ | 12.037.000.000 US$ |
| 2020 | 15.000.214.216 US$ | 10.363.200.000 US$ |
| 2019 | 17.026.269.263 US$ | 13.277.000.000 US$ |
| 2018 | 16.855.447.986 US$ | 12.819.200.000 US$ |
| 2017 | 15.783.583.237 US$ | 12.446.900.000 US$ |
| 2016 | 14.898.999.754 US$ | 11.880.900.000 US$ |
| 2015 | 14.963.589.916 US$ | 11.837.600.000 US$ |
| 2014 | 13.899.217.680 US$ | 11.139.100.000 US$ |
| 2013 | 14.264.205.153 US$ | 10.475.300.000 US$ |
| 2012 | 14.807.086.556 US$ | 10.720.400.000 US$ |
| 2011 | 14.444.661.522 US$ | 10.070.450.000 US$ |
| 2010 | 13.220.549.908 US$ | 10.095.760.000 US$ |
| 2009 | 12.120.458.115 US$ | 9.981.960.000 US$ |
| 2008 | 13.709.401.520 US$ | 10.526.000.000 US$ |
| 2007 | 12.799.600.047 US$ | 10.618.340.000 US$ |
| 2006 | 11.930.179.090 US$ | 10.167.250.000 US$ |
| 2005 | 11.243.865.778 US$ | 9.836.200.000 US$ |
| 2004 | 10.174.664.854 US$ | 9.055.290.000 US$ |
| 2003 | 9.430.234.811 US$ | 8.870.090.000 US$ |
| 2002 | 9.719.009.495 US$ | 8.881.160.000 US$ |
| 2001 | 9.194.727.831 US$ | 8.317.830.000 US$ |
| 2000 | 9.005.064.475 US$ | 8.076.470.000 US$ |
| 1999 | 8.887.057.997 US$ | 7.683.870.000 US$ |
| 1998 | 8.787.195.622 US$ | 6.833.220.000 US$ |
| 1997 | 8.400.041.724 US$ | 6.332.360.000 US$ |
| 1996 | 7.393.891.921 US$ | 3.609.000.000 US$ |
| 1995 | 6.577.520.643 US$ | 3.429.000.000 US$ |
| 1994 | 5.452.558.947 US$ | 3.259.000.000 US$ |
| 1993 | 5.440.075.676 US$ | 3.092.000.000 US$ |
| 1992 | 3.535.460.090 US$ | 3.109.000.000 US$ |
| 1991 | 4.106.207.649 US$ | 3.111.160.000 US$ |
| 1990 | 4.592.208.087 US$ | 3.166.000.000 US$ |
| 1989 | 4.404.937.853 US$ | 3.062.000.000 US$ |
| 1988 | 3.828.342.820 US$ | 2.817.900.000 US$ |
| 1987 | 3.287.007.322 US$ | 2.713.999.900 US$ |
| 1986 | 2.754.549.582 US$ | 2.472.500.000 US$ |
| 1985 | 2.100.239.019 US$ | 2.320.699.900 US$ |
| 1984 | 2.373.564.549 US$ | 2.041.100.000 US$ |
| 1983 | 3.619.262.277 US$ | 1.732.800.000 US$ |
| 1982 | 3.293.496.312 US$ | 1.578.300.000 US$ |
| 1981 | 2.979.027.966 US$ | 1.426.500.000 US$ |
| 1980 | 2.679.379.372 US$ | 1.335.300.000 US$ |
| 1979 | 2.425.064.229 US$ | 1.139.800.100 US$ |
| 1978 | 2.644.527.822 US$ | 832.400.000 US$ |
| 1977 | 3.249.733.140 US$ | 713.000.000 US$ |
| 1976 | 2.966.042.856 US$ | 642.100.000 US$ |
| 1975 | 2.860.442.750 US$ | 596.200.000 US$ |
| 1974 | 2.375.122.375 US$ | 632.400.000 US$ |
| 1973 | 1.905.917.553 US$ | 670.900.000 US$ |
| 1972 | 1.875.146.587 US$ | 590.900.000 US$ |
| 1971 | 1.539.861.816 US$ | 573.400.000 US$ |
| 1970 | 1.404.720.442 US$ | 539.500.000 US$ |
| 1969 | 1.191.239.047 US$ | 538.700.000 US$ |
| 1968 | 1.083.839.133 US$ | 453.800.000 US$ |
| 1967 | 1.148.014.311 US$ | 398.000.000 US$ |
| 1966 | 1.096.759.561 US$ | 346.800.000 US$ |
| 1965 | 972.159.611 US$ | 300.272.048 US$ |
| 1964 | 897.949.001 US$ | 266.560.043 US$ |
| 1963 | 826.706.669 US$ | 237.650.038 US$ |
| 1962 | 777.727.689 US$ | 212.170.034 US$ |
| 1961 | 748.043.501 US$ | 190.022.030 US$ |
| 1960 | 699.064.380 US$ | 169.736.027 US$ |
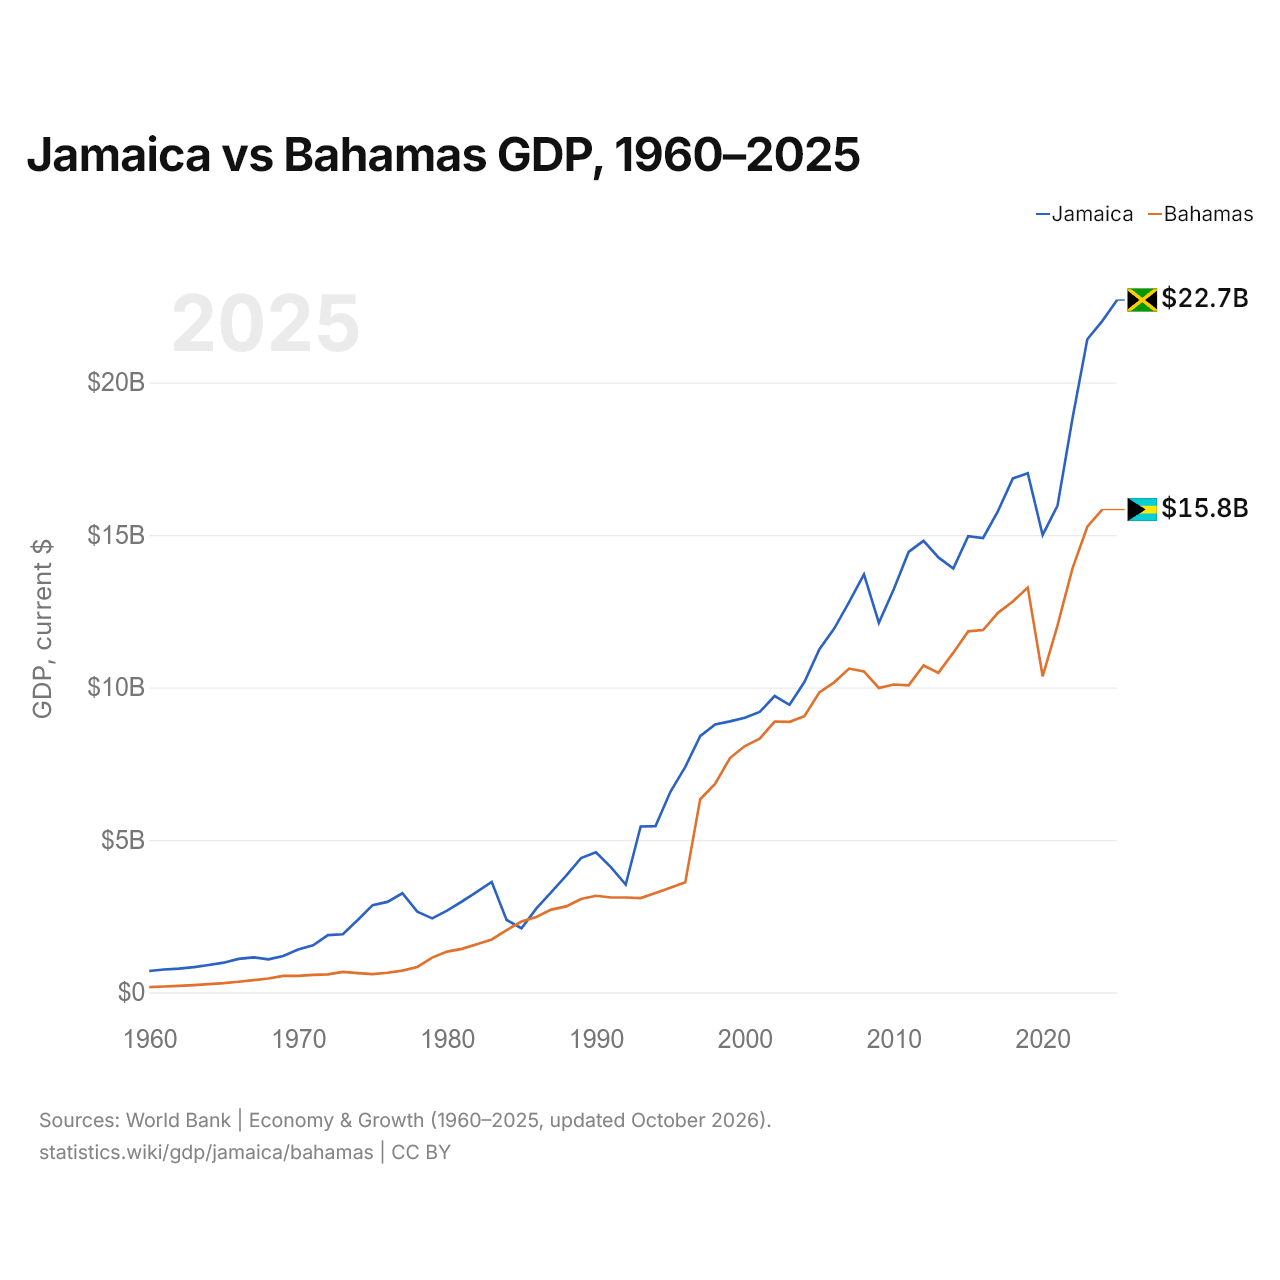
El PIB de Jamaica (22 mil millones de US$, 2024) fue un 39 % mayor que el de las Bahamas (15,8 mil millones de US$, 2024). En 2014 era un 25 % mayor. Desde 2014, a precios constantes de 2015, el PIB de Jamaica ha crecido un 16,7 % y el de las Bahamas, un 16,3 %.
Desde 1986, el PIB de Jamaica es el mayor de los dos; también lo era en 1960, cuando era 4,1 veces el de las Bahamas. El PIB per cápita es de 8003 US$ en Jamaica (2025) y de 39.455 US$ en las Bahamas (2024).
Jamaica vs Bahamas: últimos datos del PIB
|
Jamaica
|
Bahamas
|
|
|---|---|---|
| PIB, US$ corrientes | 22,7 mil M US$ (2025) | 15,8 mil M US$ (2024) |
| Puesto mundial | 125/197 | 145/197 |
| Porcentaje del mundo | 0,02 % | 0,01 % |
| PIB, US$ constantes de 2015 | 17,3 mil M US$ (2025) | 13,6 mil M US$ (2024) |
Comparar el PIB de 2 países cualesquiera
Fuentes:
- Banco Mundial | Economía y crecimiento (1960–2025, actualizado en octubre de 2026)
Creative Commons Atribución (CC BY): puedes copiar, compartir, adaptar y reutilizar este contenido, también con fines comerciales, siempre que cites a statistics.wiki e indiques los cambios que hayas hecho. Las fuentes indicadas arriba pueden tener sus propias condiciones de licencia.