
Alemania vs Egipto: PIB, 1960–2025
| Año | PIB, US$ corrientes | |
|---|---|---|
 Alemania |
 Egipto |
|
| 2025 | 5.050.922.925.047 US$ | 365.254.630.180 US$ |
| 2024 | 4.685.592.577.805 US$ | 389.059.910.593 US$ |
| 2023 | 4.562.207.532.490 US$ | 395.926.071.448 US$ |
| 2022 | 4.201.021.706.479 US$ | 476.747.720.365 US$ |
| 2021 | 4.355.251.953.411 US$ | 424.671.765.456 US$ |
| 2020 | 3.941.398.957.074 US$ | 383.817.841.547 US$ |
| 2019 | 3.959.894.794.039 US$ | 318.678.815.490 US$ |
| 2018 | 4.055.433.215.302 US$ | 262.588.632.527 US$ |
| 2017 | 3.765.351.626.106 US$ | 248.362.771.739 US$ |
| 2016 | 3.536.787.895.179 US$ | 332.441.717.791 US$ |
| 2015 | 3.425.099.578.746 US$ | 329.366.576.819 US$ |
| 2014 | 3.964.870.735.761 US$ | 305.595.408.895 US$ |
| 2013 | 3.807.023.797.051 US$ | 288.434.108.527 US$ |
| 2012 | 3.596.483.233.406 US$ | 279.116.666.667 US$ |
| 2011 | 3.823.575.803.794 US$ | 235.989.672.978 US$ |
| 2010 | 3.467.093.769.667 US$ | 218.983.666.062 US$ |
| 2009 | 3.478.545.516.684 US$ | 189.147.005.445 US$ |
| 2008 | 3.808.197.720.125 US$ | 162.818.181.818 US$ |
| 2007 | 3.484.056.680.855 US$ | 130.437.828.371 US$ |
| 2006 | 3.046.308.753.671 US$ | 107.426.086.957 US$ |
| 2005 | 2.893.393.187.362 US$ | 89.660.339.660 US$ |
| 2004 | 2.852.317.768.062 US$ | 78.782.467.532 US$ |
| 2003 | 2.534.715.518.349 US$ | 80.288.461.538 US$ |
| 2002 | 2.102.350.798.306 US$ | 85.146.067.416 US$ |
| 2001 | 1.966.381.496.642 US$ | 96.684.636.119 US$ |
| 2000 | 1.966.980.701.145 US$ | 99.838.543.960 US$ |
| 1999 | 2.213.873.468.587 US$ | 90.710.704.807 US$ |
| 1998 | 2.247.760.364.566 US$ | 84.828.807.556 US$ |
| 1997 | 2.218.790.886.533 US$ | 78.436.578.171 US$ |
| 1996 | 2.506.576.553.158 US$ | 67.629.716.981 US$ |
| 1995 | 2.593.053.091.306 US$ | 60.159.245.060 US$ |
| 1994 | 2.215.282.632.277 US$ | 51.897.983.393 US$ |
| 1993 | 2.078.954.217.438 US$ | 46.578.631.453 US$ |
| 1992 | 2.141.377.582.968 US$ | 41.855.986.519 US$ |
| 1991 | 1.875.792.575.133 US$ | 37.387.836.491 US$ |
| 1990 | 1.778.162.195.860 US$ | 42.978.914.311 US$ |
| 1989 | 1.404.092.925.205 US$ | 39.756.299.050 US$ |
| 1988 | 1.406.367.016.372 US$ | 34.980.124.929 US$ |
| 1987 | 1.302.932.318.825 US$ | 40.455.616.654 US$ |
| 1986 | 1.050.092.624.516 US$ | 41.253.507.951 US$ |
| 1985 | 735.218.723.093 US$ | 39.053.502.251 US$ |
| 1984 | 727.767.760.979 US$ | 33.971.188.992 US$ |
| 1983 | 773.507.930.295 US$ | 30.966.239.814 US$ |
| 1982 | 779.421.633.755 US$ | 27.655.172.414 US$ |
| 1981 | 803.404.797.058 US$ | 22.136.081.081 US$ |
| 1980 | 953.772.499.462 US$ | 21.669.908.176 US$ |
| 1979 | 884.574.218.333 US$ | 18.020.571.429 US$ |
| 1978 | 743.182.891.918 US$ | 14.811.704.063 US$ |
| 1977 | 602.698.323.086 US$ | 14.400.806.876 US$ |
| 1976 | 521.658.712.133 US$ | 13.315.988.083 US$ |
| 1975 | 492.434.094.920 US$ | 11.632.178.869 US$ |
| 1974 | 446.934.971.657 US$ | 9.228.963.225 US$ |
| 1973 | 399.833.571.167 US$ | 10.098.534.613 US$ |
| 1972 | 300.899.944.795 US$ | 9.299.638.056 US$ |
| 1971 | 250.900.942.397 US$ | 8.609.283.346 US$ |
| 1970 | 216.629.229.947 US$ | 8.042.200.452 US$ |
| 1969 | 177.733.486.326 US$ | 6.524.455.206 US$ |
| 1968 | 156.527.292.653 US$ | 5.932.242.991 US$ |
| 1967 | 145.100.667.773 US$ | 5.605.484.299 US$ |
| 1966 | 143.304.275.684 US$ | 5.278.005.612 US$ |
| 1965 | 134.774.688.191 US$ | 4.948.667.540 US$ |
| 1964 | 123.330.404.665 US$ | 4.709.245.762 US$ |
| 1963 | 112.232.503.744 US$ | 4.187.146.232 US$ |
| 1962 | 105.895.435.234 US$ | 4.035.462.027 US$ |
| 1961 | 96.558.204.043 US$ | 4.494.575.611 US$ |
| 1960 | 84.619.845.881 US$ | 4.206.270.352 US$ |
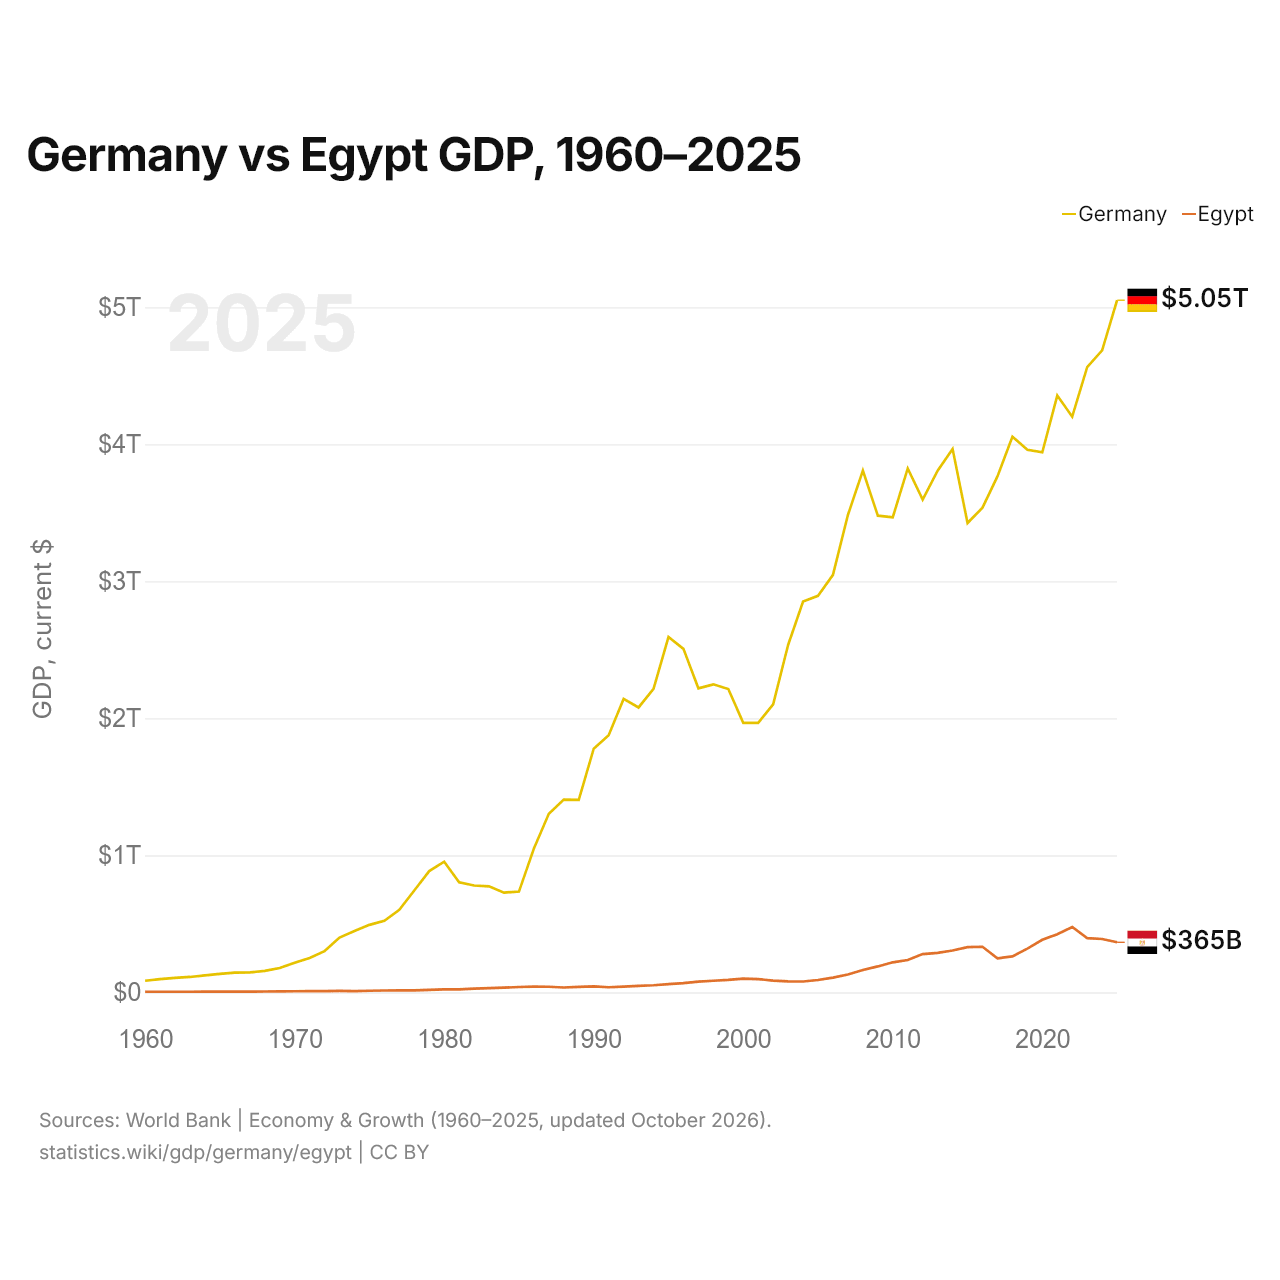
En 2025, el PIB de Alemania (5,05 billones de US$) fue 14 veces el de Egipto (365 mil millones de US$). En 2015 era 10 veces. De 2015 a 2025, a precios constantes de 2015, el PIB de Alemania creció un 7,6 % y el de Egipto, un 52,8 %.
Desde 1960, el PIB de Alemania ha sido cada año el mayor de los dos; en 1960, era 20 veces el de Egipto. En 2025, el PIB per cápita fue de 60.496 US$ en Alemania y de 3086 US$ en Egipto: 20 veces más alto en Alemania.
Alemania vs Egipto: últimos datos del PIB
|
Alemania
|
Egipto
|
|
|---|---|---|
| PIB, US$ corrientes | 5,05 B US$ | 365 mil M US$ |
| Puesto mundial | 3/197 | 43/197 |
| Porcentaje del mundo | 4,27 % | 0,31 % |
| PIB, US$ constantes de 2015 | 3,69 B US$ | 503 mil M US$ |
| Diferencia de PIB | 14× | 0,072× |
Comparar el PIB de 2 países cualesquiera
Fuentes:
- Banco Mundial | Economía y crecimiento (1960–2025, actualizado en octubre de 2026)
Creative Commons Atribución (CC BY): puedes copiar, compartir, adaptar y reutilizar este contenido, también con fines comerciales, siempre que cites a statistics.wiki e indiques los cambios que hayas hecho. Las fuentes indicadas arriba pueden tener sus propias condiciones de licencia.