
Francia vs Argelia: PIB, 1960–2025
| Año | PIB, US$ corrientes | |
|---|---|---|
 Francia |
 Argelia |
|
| 2025 | 3.366.315.927.447 US$ | 287.031.225.988 US$ |
| 2024 | 3.160.442.622.465 US$ | 269.322.281.665 US$ |
| 2023 | 3.056.250.648.138 US$ | 247.923.887.215 US$ |
| 2022 | 2.794.788.137.067 US$ | 225.581.644.703 US$ |
| 2021 | 2.966.433.692.008 US$ | 186.231.205.262 US$ |
| 2020 | 2.647.926.055.110 US$ | 164.873.415.325 US$ |
| 2019 | 2.722.793.515.172 US$ | 193.459.662.091 US$ |
| 2018 | 2.781.576.320.884 US$ | 194.554.483.656 US$ |
| 2017 | 2.588.868.323.335 US$ | 189.880.896.903 US$ |
| 2016 | 2.470.407.619.777 US$ | 180.763.839.522 US$ |
| 2015 | 2.442.483.452.643 US$ | 187.493.855.609 US$ |
| 2014 | 2.861.236.112.552 US$ | 238.942.664.193 US$ |
| 2013 | 2.816.077.607.875 US$ | 229.701.430.292 US$ |
| 2012 | 2.683.007.095.787 US$ | 227.143.746.076 US$ |
| 2011 | 2.870.408.553.990 US$ | 218.331.946.925 US$ |
| 2010 | 2.646.230.027.988 US$ | 177.785.053.940 US$ |
| 2009 | 2.700.075.882.519 US$ | 150.317.292.079 US$ |
| 2008 | 2.926.802.941.586 US$ | 180.383.848.331 US$ |
| 2007 | 2.655.816.911.867 US$ | 142.482.739.810 US$ |
| 2006 | 2.317.861.544.691 US$ | 123.084.258.693 US$ |
| 2005 | 2.192.146.403.028 US$ | 107.046.618.670 US$ |
| 2004 | 2.109.792.297.237 US$ | 91.913.680.985 US$ |
| 2003 | 1.835.095.983.049 US$ | 73.482.264.191 US$ |
| 2002 | 1.492.427.756.382 US$ | 61.516.103.406 US$ |
| 2001 | 1.370.376.677.299 US$ | 59.413.400.924 US$ |
| 2000 | 1.360.959.069.477 US$ | 54.790.398.570 US$ |
| 1999 | 1.486.915.879.702 US$ | 48.640.671.735 US$ |
| 1998 | 1.496.906.382.032 US$ | 48.187.781.984 US$ |
| 1997 | 1.449.392.222.971 US$ | 48.177.612.042 US$ |
| 1996 | 1.598.889.216.566 US$ | 46.941.554.225 US$ |
| 1995 | 1.595.219.345.512 US$ | 41.764.291.672 US$ |
| 1994 | 1.385.822.778.828 US$ | 42.543.176.829 US$ |
| 1993 | 1.314.383.368.080 US$ | 49.945.584.453 US$ |
| 1992 | 1.389.663.073.110 US$ | 48.003.133.347 US$ |
| 1991 | 1.258.961.748.634 US$ | 45.715.676.428 US$ |
| 1990 | 1.257.649.439.827 US$ | 62.048.507.531 US$ |
| 1989 | 1.016.742.237.302 US$ | 55.634.721.573 US$ |
| 1988 | 1.010.827.662.152 US$ | 59.089.396.860 US$ |
| 1987 | 926.320.855.615 US$ | 66.745.818.375 US$ |
| 1986 | 764.946.585.851 US$ | 63.692.007.897 US$ |
| 1985 | 547.220.981.165 US$ | 57.937.868.670 US$ |
| 1984 | 525.033.325.828 US$ | 53.698.548.293 US$ |
| 1983 | 553.356.312.936 US$ | 48.801.369.800 US$ |
| 1982 | 578.152.310.610 US$ | 45.207.167.470 US$ |
| 1981 | 609.184.791.792 US$ | 44.348.590.461 US$ |
| 1980 | 694.529.183.483 US$ | 42.345.829.079 US$ |
| 1979 | 608.218.624.730 US$ | 33.243.706.860 US$ |
| 1978 | 501.724.418.605 US$ | 26.364.491.313 US$ |
| 1977 | 406.401.711.688 US$ | 20.972.113.685 US$ |
| 1976 | 368.363.152.144 US$ | 17.728.240.932 US$ |
| 1975 | 357.324.307.786 US$ | 15.557.902.754 US$ |
| 1974 | 282.739.225.314 US$ | 13.209.871.626 US$ |
| 1973 | 261.970.536.240 US$ | 8.707.858.912 US$ |
| 1972 | 201.738.881.664 US$ | 6.766.743.957 US$ |
| 1971 | 164.694.210.962 US$ | 5.077.183.094 US$ |
| 1970 | 147.312.861.698 US$ | 4.863.526.897 US$ |
| 1969 | 140.660.914.841 US$ | 4.257.253.264 US$ |
| 1968 | 128.710.572.572 US$ | 3.852.147.027 US$ |
| 1967 | 118.088.635.381 US$ | 3.370.870.376 US$ |
| 1966 | 109.306.730.313 US$ | 3.039.859.187 US$ |
| 1965 | 100.927.668.584 US$ | 3.136.284.307 US$ |
| 1964 | 93.424.179.943 US$ | 2.909.316.435 US$ |
| 1963 | 84.227.606.650 US$ | 2.702.982.018 US$ |
| 1962 | 75.196.980.365 US$ | 2.001.444.544 US$ |
| 1961 | 67.158.050.215 US$ | 2.434.747.056 US$ |
| 1960 | 61.959.085.885 US$ | 2.723.615.451 US$ |
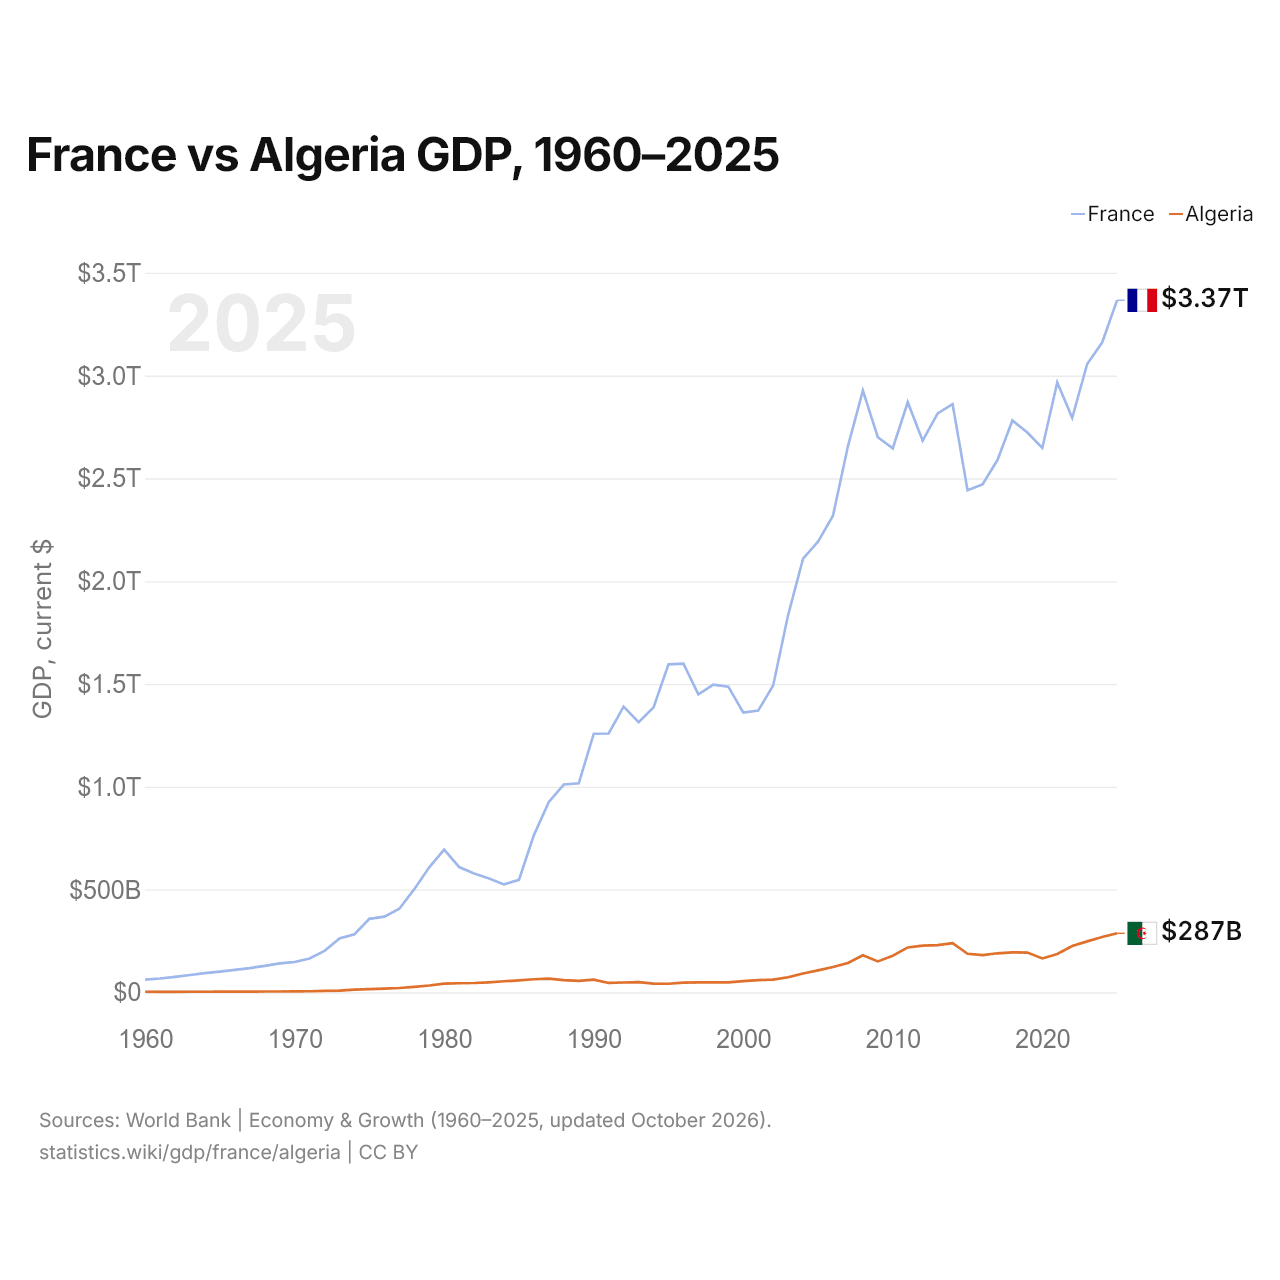
En 2025, el PIB de Francia (3,37 billones de US$) fue 12 veces el de Argelia (287 mil millones de US$). En 2015 era 13 veces. De 2015 a 2025, a precios constantes de 2015, el PIB de Francia creció un 12,3 % y el de Argelia, un 23,5 %.
Desde 1960, el PIB de Francia ha sido cada año el mayor de los dos; en 1960, era 23 veces el de Argelia. En 2025, el PIB per cápita fue de 48.986 US$ en Francia y de 6051 US$ en Argelia: 8,1 veces más alto en Francia.
Francia vs Argelia: últimos datos del PIB
|
Francia
|
Argelia
|
|
|---|---|---|
| PIB, US$ corrientes | 3,37 B US$ | 287 mil M US$ |
| Puesto mundial | 7/197 | 51/197 |
| Porcentaje del mundo | 2,84 % | 0,24 % |
| PIB, US$ constantes de 2015 | 2,74 B US$ | 232 mil M US$ |
| Diferencia de PIB | 12× | 0,085× |
Comparar el PIB de 2 países cualesquiera
Fuentes:
- Banco Mundial | Economía y crecimiento (1960–2025, actualizado en octubre de 2026)
Creative Commons Atribución (CC BY): puedes copiar, compartir, adaptar y reutilizar este contenido, también con fines comerciales, siempre que cites a statistics.wiki e indiques los cambios que hayas hecho. Las fuentes indicadas arriba pueden tener sus propias condiciones de licencia.