
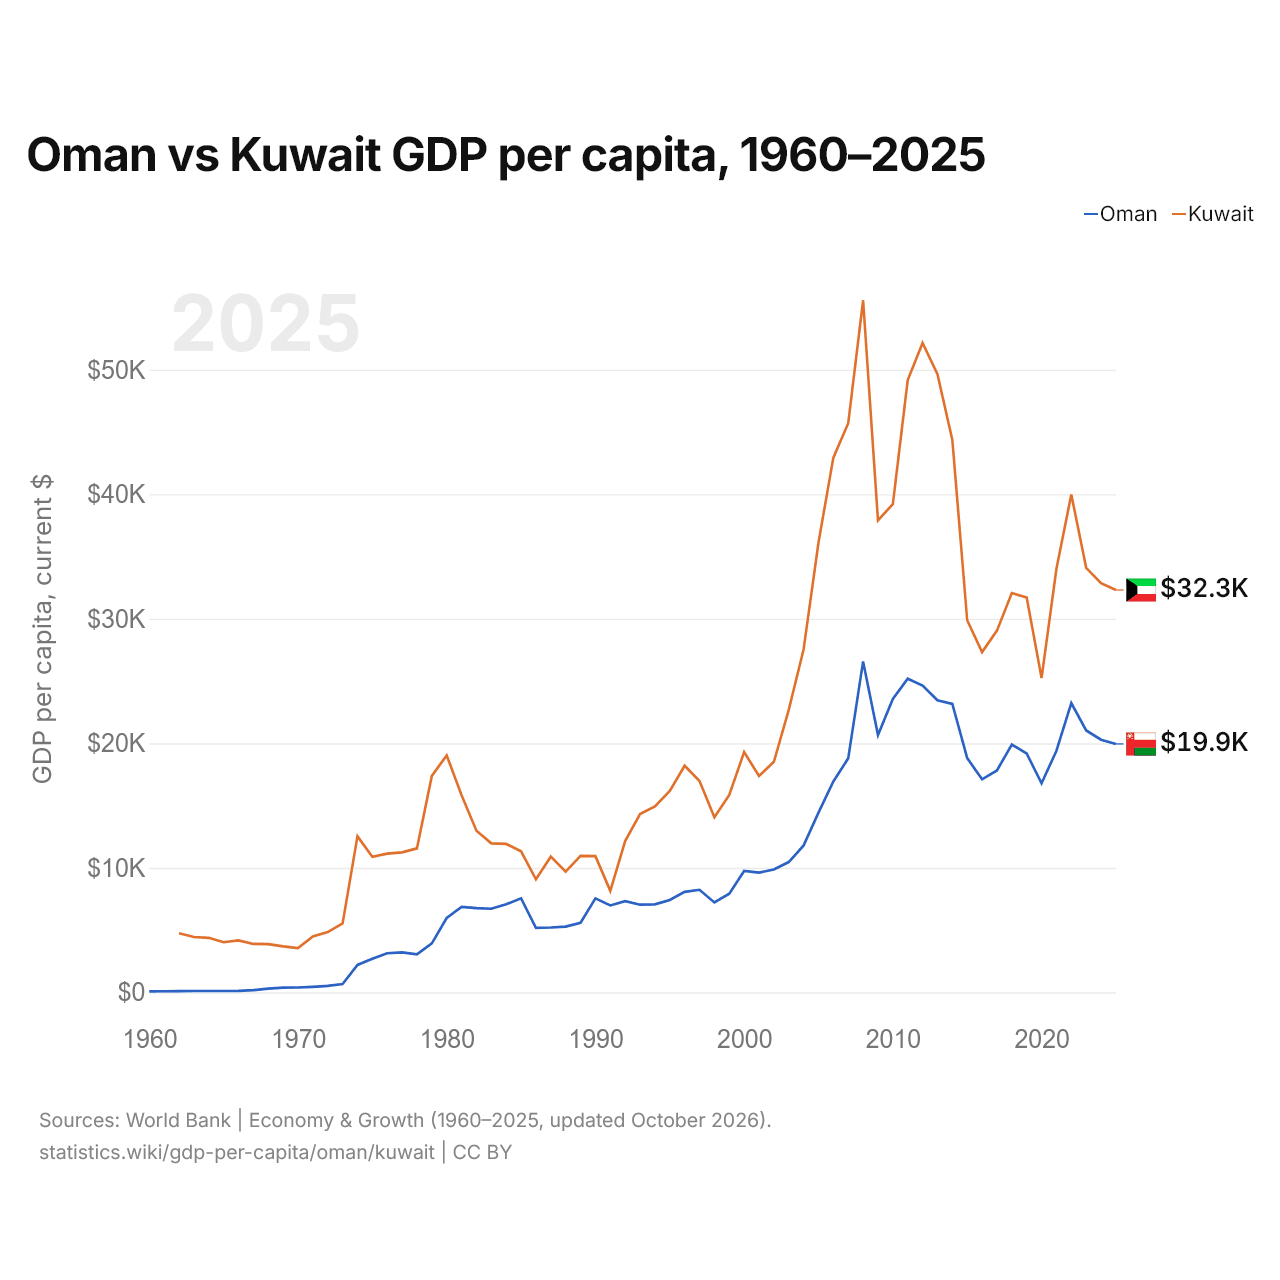
Omán vs Kuwait: PIB per cápita, 1960–2025
1x
| Año | PIB per cápita, US$ corrientes | |
|---|---|---|
 Omán |
 Kuwait |
|
| 2025 | 19.947 US$ | 32.312 US$ |
| 2024 | 20.285 US$ | 32.856 US$ |
| 2023 | 21.028 US$ | 34.092 US$ |
| 2022 | 23.224 US$ | 39.982 US$ |
| 2021 | 19.403 US$ | 34.019 US$ |
| 2020 | 16.785 US$ | 25.236 US$ |
| 2019 | 19.180 US$ | 31.708 US$ |
| 2018 | 19.902 US$ | 32.068 US$ |
| 2017 | 17.820 US$ | 29.048 US$ |
| 2016 | 17.110 US$ | 27.324 US$ |
| 2015 | 18.808 US$ | 29.882 US$ |
| 2014 | 23.161 US$ | 44.369 US$ |
| 2013 | 23.458 US$ | 49.651 US$ |
| 2012 | 24.642 US$ | 52.155 US$ |
| 2011 | 25.188 US$ | 49.170 US$ |
| 2010 | 23.570 US$ | 39.212 US$ |
| 2009 | 20.656 US$ | 37.907 US$ |
| 2008 | 26.577 US$ | 55.585 US$ |
| 2007 | 18.793 US$ | 45.709 US$ |
| 2006 | 16.931 US$ | 42.947 US$ |
| 2005 | 14.435 US$ | 36.123 US$ |
| 2004 | 11.801 US$ | 27.552 US$ |
| 2003 | 10.464 US$ | 22.691 US$ |
| 2002 | 9.869 US$ | 18.513 US$ |
| 2001 | 9.612 US$ | 17.374 US$ |
| 2000 | 9.754 US$ | 19.296 US$ |
| 1999 | 7.915 US$ | 15.854 US$ |
| 1998 | 7.219 US$ | 14.067 US$ |
| 1997 | 8.235 US$ | 16.977 US$ |
| 1996 | 8.068 US$ | 18.201 US$ |
| 1995 | 7.414 US$ | 16.168 US$ |
| 1994 | 7.068 US$ | 14.930 US$ |
| 1993 | 7.039 US$ | 14.318 US$ |
| 1992 | 7.318 US$ | 12.146 US$ |
| 1991 | 6.977 US$ | 8.147 US$ |
| 1990 | 7.546 US$ | 10.938 US$ |
| 1989 | 5.591 US$ | 10.965 US$ |
| 1988 | 5.279 US$ | 9.692 US$ |
| 1987 | 5.204 US$ | 10.896 US$ |
| 1986 | 5.182 US$ | 9.077 US$ |
| 1985 | 7.549 US$ | 11.322 US$ |
| 1984 | 7.070 US$ | 11.919 US$ |
| 1983 | 6.714 US$ | 11.965 US$ |
| 1982 | 6.759 US$ | 12.979 US$ |
| 1981 | 6.866 US$ | 15.825 US$ |
| 1980 | 5.974 US$ | 19.032 US$ |
| 1979 | 3.934 US$ | 17.386 US$ |
| 1978 | 3.044 US$ | 11.567 US$ |
| 1977 | 3.205 US$ | 11.238 US$ |
| 1976 | 3.143 US$ | 11.141 US$ |
| 1975 | 2.692 US$ | 10.882 US$ |
| 1974 | 2.203 US$ | 12.527 US$ |
| 1973 | 670 US$ | 5.532 US$ |
| 1972 | 524 US$ | 4.836 US$ |
| 1971 | 442 US$ | 4.486 US$ |
| 1970 | 387 US$ | 3.552 US$ |
| 1969 | 372 US$ | 3.695 US$ |
| 1968 | 300 US$ | 3.872 US$ |
| 1967 | 174,7 US$ | 3.887 US$ |
| 1966 | 113,2 US$ | 4.176 US$ |
| 1965 | 108,1 US$ | 4.024 US$ |
| 1964 | 108,1 US$ | 4.379 US$ |
| 1963 | 106,8 US$ | 4.445 US$ |
| 1962 | 102,3 US$ | 4.748 US$ |
| 1961 | 84,5 US$ | - |
| 1960 | 83,4 US$ | - |
En 2025, el PIB per cápita fue de 19.947 US$ en Omán y de 32.312 US$ en Kuwait: 1,6 veces más alto en Kuwait. En 1962 era de 102 US$ en Omán y de 4748 US$ en Kuwait, 46 veces más alto en Kuwait.
El PIB per cápita de Kuwait ha sido más alto que el de Omán todos los años desde 1962. A precios constantes de 2015, de 1970 a 2025, el PIB per cápita de Omán creció un 56 %, y el de Kuwait cayó un 64 %.
Omán vs Kuwait: últimos datos del PIB per cápita
|
Omán
|
Kuwait
|
|
|---|---|---|
| PIB per cápita, US$ corrientes | 19.947 US$ | 32.312 US$ |
| Puesto mundial | 60/197 | 41/197 |
| PIB per cápita, US$ constantes de 2015 | 17.074 US$ | 24.963 US$ |
| × media mundial | 1,38× | 2,24× |
| Diferencia de PIB per cápita | 0,62× | 1,6× |
Comparar el PIB per cápita de 2 países cualesquiera
Fuentes:
- Banco Mundial | Economía y crecimiento (1960–2025, actualizado en octubre de 2026)
Creative Commons Atribución (CC BY): puedes copiar, compartir, adaptar y reutilizar este contenido, también con fines comerciales, siempre que cites a statistics.wiki e indiques los cambios que hayas hecho. Las fuentes indicadas arriba pueden tener sus propias condiciones de licencia.