
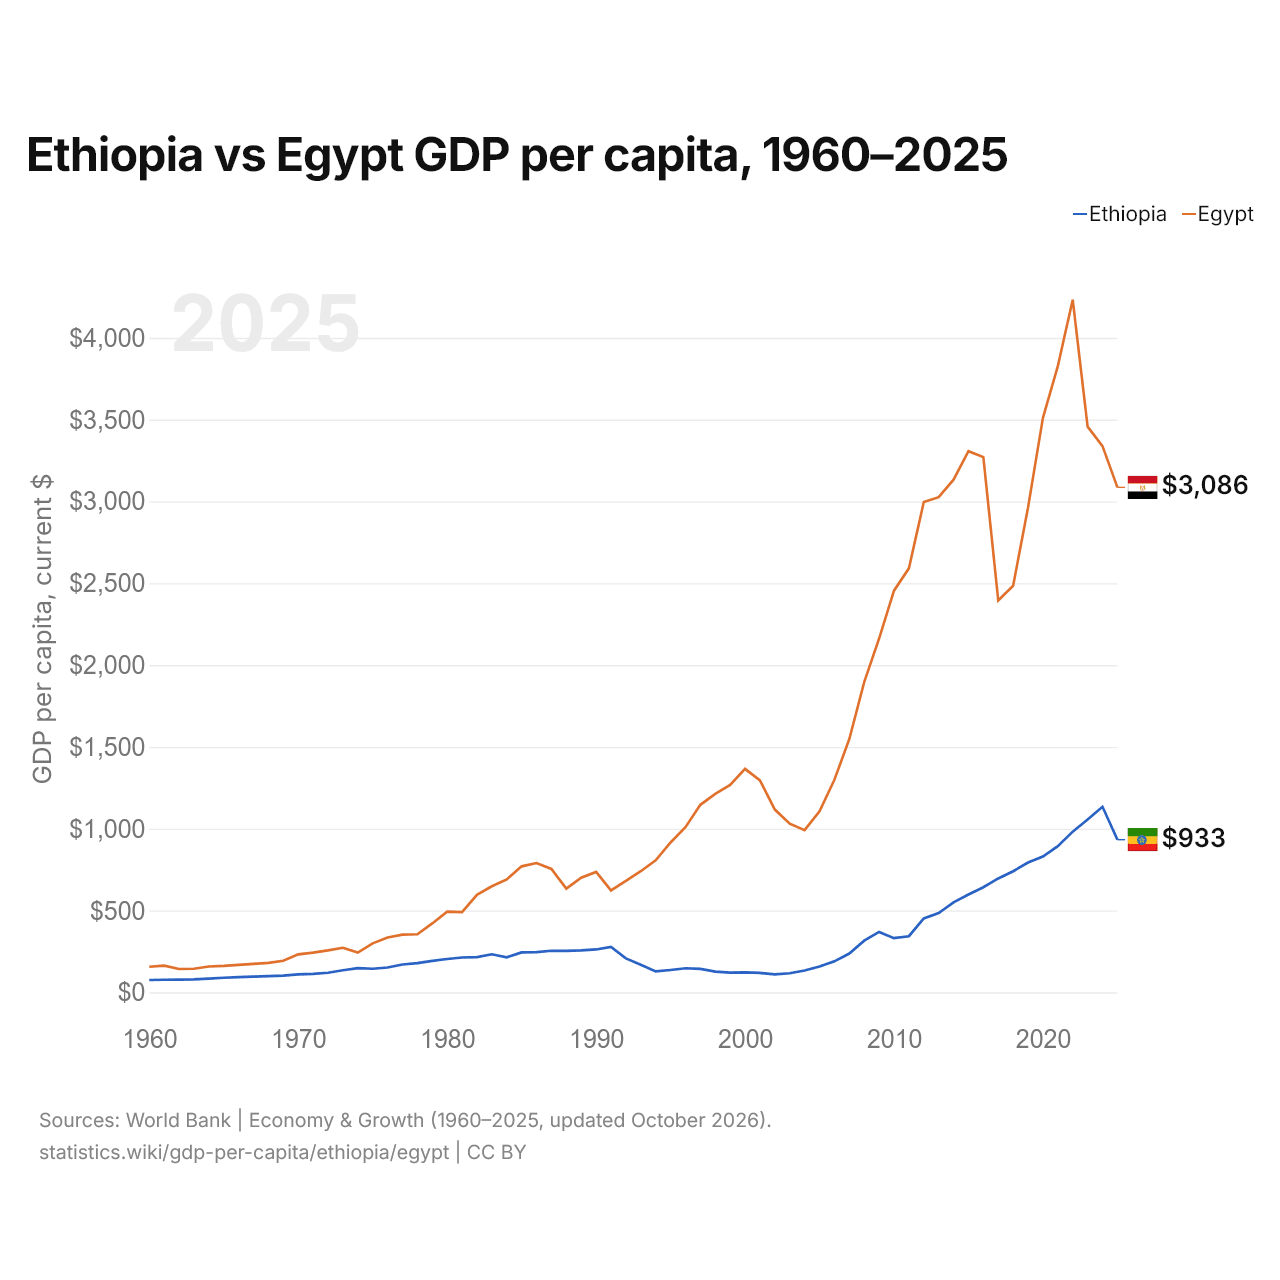
Etiopía vs Egipto: PIB per cápita, 1960–2025
1x
| Año | PIB per cápita, US$ corrientes | |
|---|---|---|
 Etiopía |
 Egipto |
|
| 2025 | 933 US$ | 3.086 US$ |
| 2024 | 1.134 US$ | 3.338 US$ |
| 2023 | 1.056 US$ | 3.457 US$ |
| 2022 | 982 US$ | 4.233 US$ |
| 2021 | 893 US$ | 3.827 US$ |
| 2020 | 830 US$ | 3.511 US$ |
| 2019 | 793 US$ | 2.963 US$ |
| 2018 | 740 US$ | 2.485 US$ |
| 2017 | 696 US$ | 2.395 US$ |
| 2016 | 642 US$ | 3.271 US$ |
| 2015 | 598 US$ | 3.307 US$ |
| 2014 | 550 US$ | 3.133 US$ |
| 2013 | 484 US$ | 3.026 US$ |
| 2012 | 452 US$ | 2.996 US$ |
| 2011 | 343 US$ | 2.591 US$ |
| 2010 | 331 US$ | 2.455 US$ |
| 2009 | 369 US$ | 2.162 US$ |
| 2008 | 316 US$ | 1.896 US$ |
| 2007 | 237,1 US$ | 1.548 US$ |
| 2006 | 189,3 US$ | 1.299 US$ |
| 2005 | 158,2 US$ | 1.106 US$ |
| 2004 | 133,2 US$ | 991 US$ |
| 2003 | 116,8 US$ | 1.031 US$ |
| 2002 | 109,6 US$ | 1.117 US$ |
| 2001 | 118,5 US$ | 1.295 US$ |
| 2000 | 122,3 US$ | 1.366 US$ |
| 1999 | 120,7 US$ | 1.268 US$ |
| 1998 | 126,5 US$ | 1.213 US$ |
| 1997 | 143,4 US$ | 1.146 US$ |
| 1996 | 147,3 US$ | 1.009 US$ |
| 1995 | 136,5 US$ | 916 US$ |
| 1994 | 127,7 US$ | 807 US$ |
| 1993 | 168,5 US$ | 740 US$ |
| 1992 | 207,4 US$ | 681 US$ |
| 1991 | 277,6 US$ | 623 US$ |
| 1990 | 262,1 US$ | 736 US$ |
| 1989 | 256,4 US$ | 701 US$ |
| 1988 | 253,2 US$ | 634 US$ |
| 1987 | 254,1 US$ | 754 US$ |
| 1986 | 246 US$ | 790 US$ |
| 1985 | 243,9 US$ | 770 US$ |
| 1984 | 214,2 US$ | 690 US$ |
| 1983 | 232,7 US$ | 648 US$ |
| 1982 | 215,3 US$ | 596 US$ |
| 1981 | 212,7 US$ | 490 US$ |
| 1980 | 203,7 US$ | 493 US$ |
| 1979 | 192,4 US$ | 421 US$ |
| 1978 | 178,3 US$ | 355 US$ |
| 1977 | 170,4 US$ | 353 US$ |
| 1976 | 152 US$ | 335 US$ |
| 1975 | 144,3 US$ | 299,2 US$ |
| 1974 | 147,9 US$ | 243,1 US$ |
| 1973 | 134,9 US$ | 272,2 US$ |
| 1972 | 119,8 US$ | 256,5 US$ |
| 1971 | 112,7 US$ | 243 US$ |
| 1970 | 109,4 US$ | 232,3 US$ |
| 1969 | 102,3 US$ | 193 US$ |
| 1968 | 99,5 US$ | 179,8 US$ |
| 1967 | 96,1 US$ | 174,1 US$ |
| 1966 | 93,2 US$ | 168,1 US$ |
| 1965 | 88,9 US$ | 161,6 US$ |
| 1964 | 83,8 US$ | 157,7 US$ |
| 1963 | 79,2 US$ | 143,9 US$ |
| 1962 | 77,8 US$ | 142,4 US$ |
| 1961 | 76,7 US$ | 162,8 US$ |
| 1960 | 75,3 US$ | 156,4 US$ |
En 2025, el PIB per cápita fue de 933 US$ en Etiopía y de 3086 US$ en Egipto: 3,3 veces más alto en Egipto. En 1960 era de 75 US$ en Etiopía y de 156 US$ en Egipto, 2,1 veces más alto en Egipto.
El PIB per cápita de Egipto ha sido más alto que el de Etiopía todos los años desde 1960. A precios constantes de 2015, el PIB per cápita de Etiopía en 2025 fue 4,1 veces el de 1961, y el de Egipto, 5,5 veces.
Etiopía vs Egipto: últimos datos del PIB per cápita
Comparar el PIB per cápita de 2 países cualesquiera
Fuentes:
- Banco Mundial | Economía y crecimiento (1960–2025, actualizado en octubre de 2026)
Creative Commons Atribución (CC BY): puedes copiar, compartir, adaptar y reutilizar este contenido, también con fines comerciales, siempre que cites a statistics.wiki e indiques los cambios que hayas hecho. Las fuentes indicadas arriba pueden tener sus propias condiciones de licencia.