
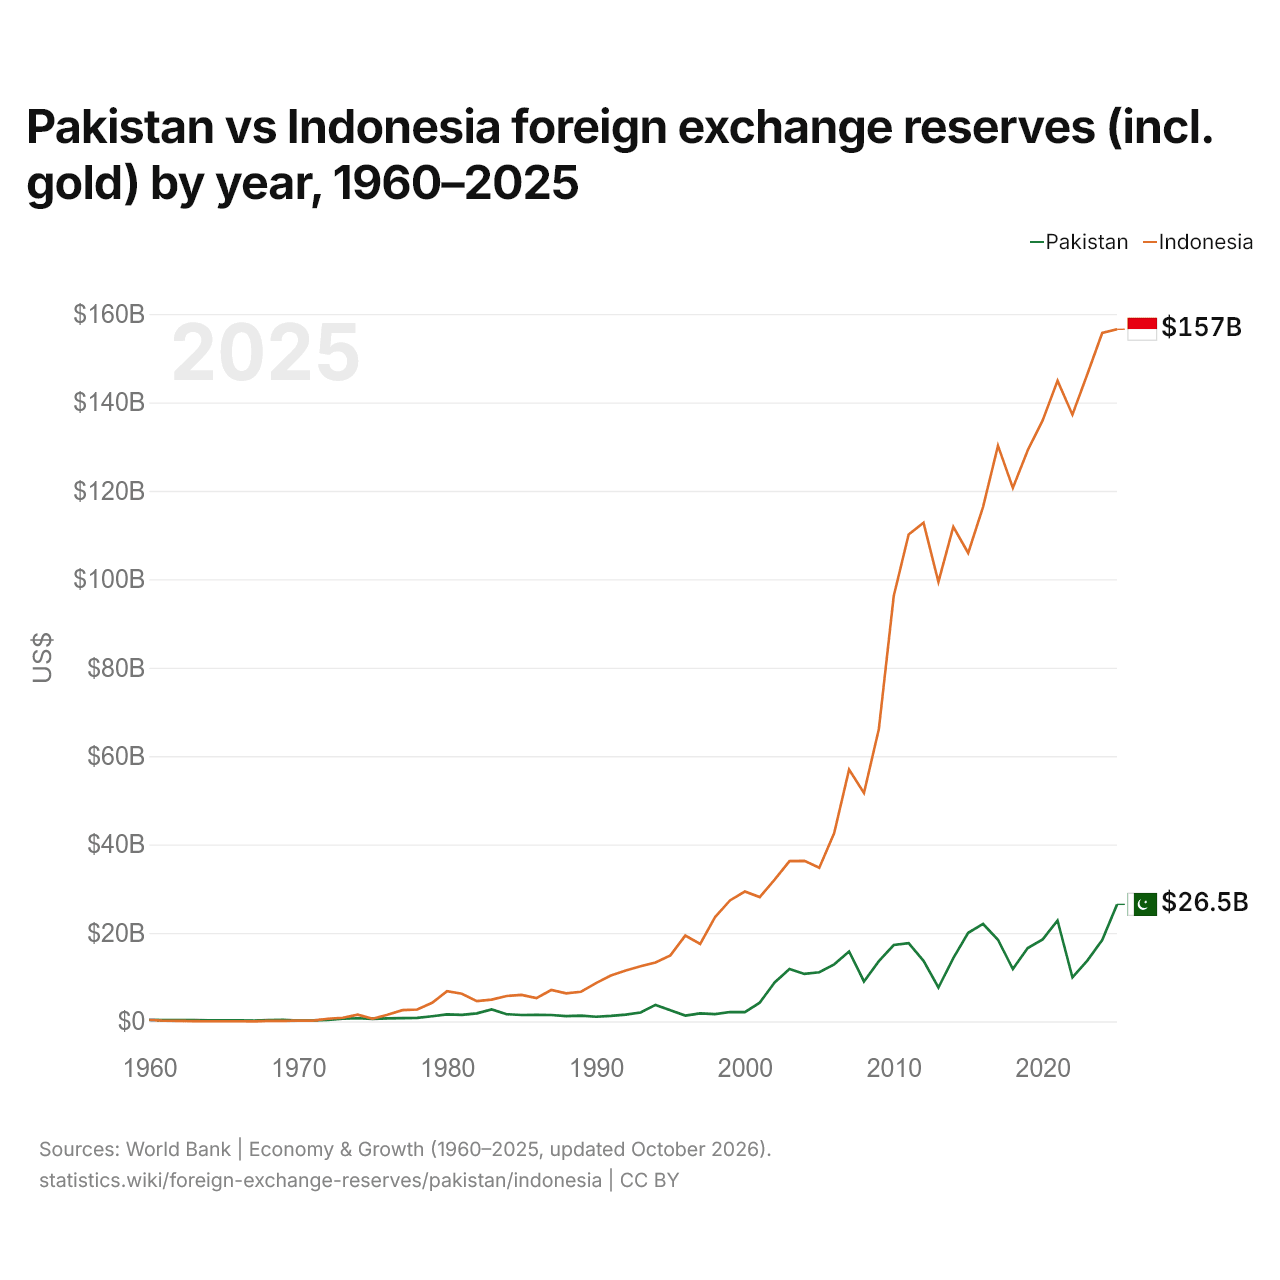
Pakistán vs Indonesia: reservas de divisas (incluido el oro) por año, 1960–2025
1x
| Año | US$ | |
|---|---|---|
 Pakistán |
 Indonesia |
|
| 2025 | 26.455.819.676 US$ | 156.542.507.870 US$ |
| 2024 | 18.407.745.861 US$ | 155.708.275.548 US$ |
| 2023 | 13.730.353.485 US$ | 146.358.992.702 US$ |
| 2022 | 9.926.587.077 US$ | 137.222.356.128 US$ |
| 2021 | 22.811.522.858 US$ | 144.907.809.744 US$ |
| 2020 | 18.521.734.364 US$ | 135.915.917.616 US$ |
| 2019 | 16.586.046.186 US$ | 129.186.464.020 US$ |
| 2018 | 11.837.177.726 US$ | 120.660.974.091 US$ |
| 2017 | 18.455.861.310 US$ | 130.215.330.383 US$ |
| 2016 | 22.027.605.270 US$ | 116.369.601.851 US$ |
| 2015 | 20.027.864.211 US$ | 105.928.847.089 US$ |
| 2014 | 14.306.811.155 US$ | 111.862.594.562 US$ |
| 2013 | 7.651.260.102 US$ | 99.386.826.239 US$ |
| 2012 | 13.688.479.776 US$ | 112.797.627.833 US$ |
| 2011 | 17.697.925.812 US$ | 110.136.597.662 US$ |
| 2010 | 17.255.570.040 US$ | 96.210.980.584 US$ |
| 2009 | 13.606.125.134 US$ | 66.118.917.968 US$ |
| 2008 | 9.024.013.987 US$ | 51.640.625.721 US$ |
| 2007 | 15.798.067.447 US$ | 56.935.744.023 US$ |
| 2006 | 12.878.021.928 US$ | 42.597.040.282 US$ |
| 2005 | 11.109.358.834 US$ | 34.730.799.049 US$ |
| 2004 | 10.718.170.457 US$ | 36.310.733.909 US$ |
| 2003 | 11.815.604.886 US$ | 36.256.203.642 US$ |
| 2002 | 8.795.802.481 US$ | 32.033.585.247 US$ |
| 2001 | 4.218.132.004 US$ | 28.103.636.180 US$ |
| 2000 | 2.087.167.574 US$ | 29.352.929.561 US$ |
| 1999 | 2.117.468.755 US$ | 27.345.097.667 US$ |
| 1998 | 1.625.676.185 US$ | 23.605.842.946 US$ |
| 1997 | 1.794.513.747 US$ | 17.486.799.643 US$ |
| 1996 | 1.307.463.615 US$ | 19.396.148.967 US$ |
| 1995 | 2.527.544.035 US$ | 14.907.558.866 US$ |
| 1994 | 3.715.827.397 US$ | 13.321.136.813 US$ |
| 1993 | 1.995.445.624 US$ | 12.474.062.371 US$ |
| 1992 | 1.523.790.726 US$ | 11.482.019.253 US$ |
| 1991 | 1.219.792.227 US$ | 10.357.989.011 US$ |
| 1990 | 1.046.429.501 US$ | 8.656.792.855 US$ |
| 1989 | 1.302.246.972 US$ | 6.699.438.101 US$ |
| 1988 | 1.192.694.259 US$ | 6.321.735.767 US$ |
| 1987 | 1.440.835.177 US$ | 7.094.971.197 US$ |
| 1986 | 1.464.868.891 US$ | 5.264.622.148 US$ |
| 1985 | 1.429.436.612 US$ | 5.989.249.388 US$ |
| 1984 | 1.610.425.670 US$ | 5.729.969.488 US$ |
| 1983 | 2.682.849.897 US$ | 4.902.569.211 US$ |
| 1982 | 1.812.777.233 US$ | 4.562.680.198 US$ |
| 1981 | 1.455.323.109 US$ | 6.248.009.714 US$ |
| 1980 | 1.567.771.125 US$ | 6.802.959.429 US$ |
| 1979 | 1.144.047.213 US$ | 4.205.180.825 US$ |
| 1978 | 795.941.588 US$ | 2.676.740.697 US$ |
| 1977 | 715.701.867 US$ | 2.536.611.976 US$ |
| 1976 | 684.140.447 US$ | 1.504.197.786 US$ |
| 1975 | 562.995.172 US$ | 592.327.932 US$ |
| 1974 | 688.502.075 US$ | 1.500.130.951 US$ |
| 1973 | 590.281.470 US$ | 811.133.005 US$ |
| 1972 | 323.798.402 US$ | 580.054.154 US$ |
| 1971 | 198.501.968 US$ | 145.119.482 US$ |
| 1970 | 194.529.622 US$ | 160.280.180 US$ |
| 1969 | 332.933.120 US$ | 121.712.800 US$ |
| 1968 | 258.389.140 US$ | 87.276.600 US$ |
| 1967 | 165.486.080 US$ | 6.012.800 US$ |
| 1966 | 208.453.006 US$ | 23.011.660 US$ |
| 1965 | 230.344.688 US$ | 21.003.680 US$ |
| 1964 | 254.226.648 US$ | 25.003.680 US$ |
| 1963 | 307.832.196 US$ | 58.079.560 US$ |
| 1962 | 269.316.859 US$ | 108.100.020 US$ |
| 1961 | 261.302.470 US$ | 133.183.550 US$ |
| 1960 | 327.400.600 US$ | 352.739.200 US$ |
En 2025, las reservas de divisas de Pakistán fueron de 26,5 mil millones de US$ y las de Indonesia, de 157 mil millones de US$: las de Indonesia fueron 5,9 veces mayores. En 1960, las reservas de Indonesia fueron un 7,7 % mayores: 327 millones de US$ de Pakistán y 353 millones de US$ de Indonesia.
Las reservas de divisas de Indonesia han sido mayores que las de Pakistán todos los años desde 1972.
Pakistán vs Indonesia: reservas, incluido el oro, y meses de importaciones cubiertos
|
Pakistán
|
Indonesia
|
|
|---|---|---|
| Reservas, incluido el oro | 26,5 mil M US$ | 157 mil M US$ |
| Meses de importaciones | 4,5 | 6,3 |
| Puesto mundial | 62/168 | 22/168 |
| Diferencia de reservas | 0,17× | 5,9× |
Comparar las reservas de divisas de 2 países cualesquiera
Fuentes:
- Banco Mundial | Economía y crecimiento (1960–2025, actualizado en octubre de 2026)
Creative Commons Atribución (CC BY): puedes copiar, compartir, adaptar y reutilizar este contenido, también con fines comerciales, siempre que cites a statistics.wiki e indiques los cambios que hayas hecho. Las fuentes indicadas arriba pueden tener sus propias condiciones de licencia.