
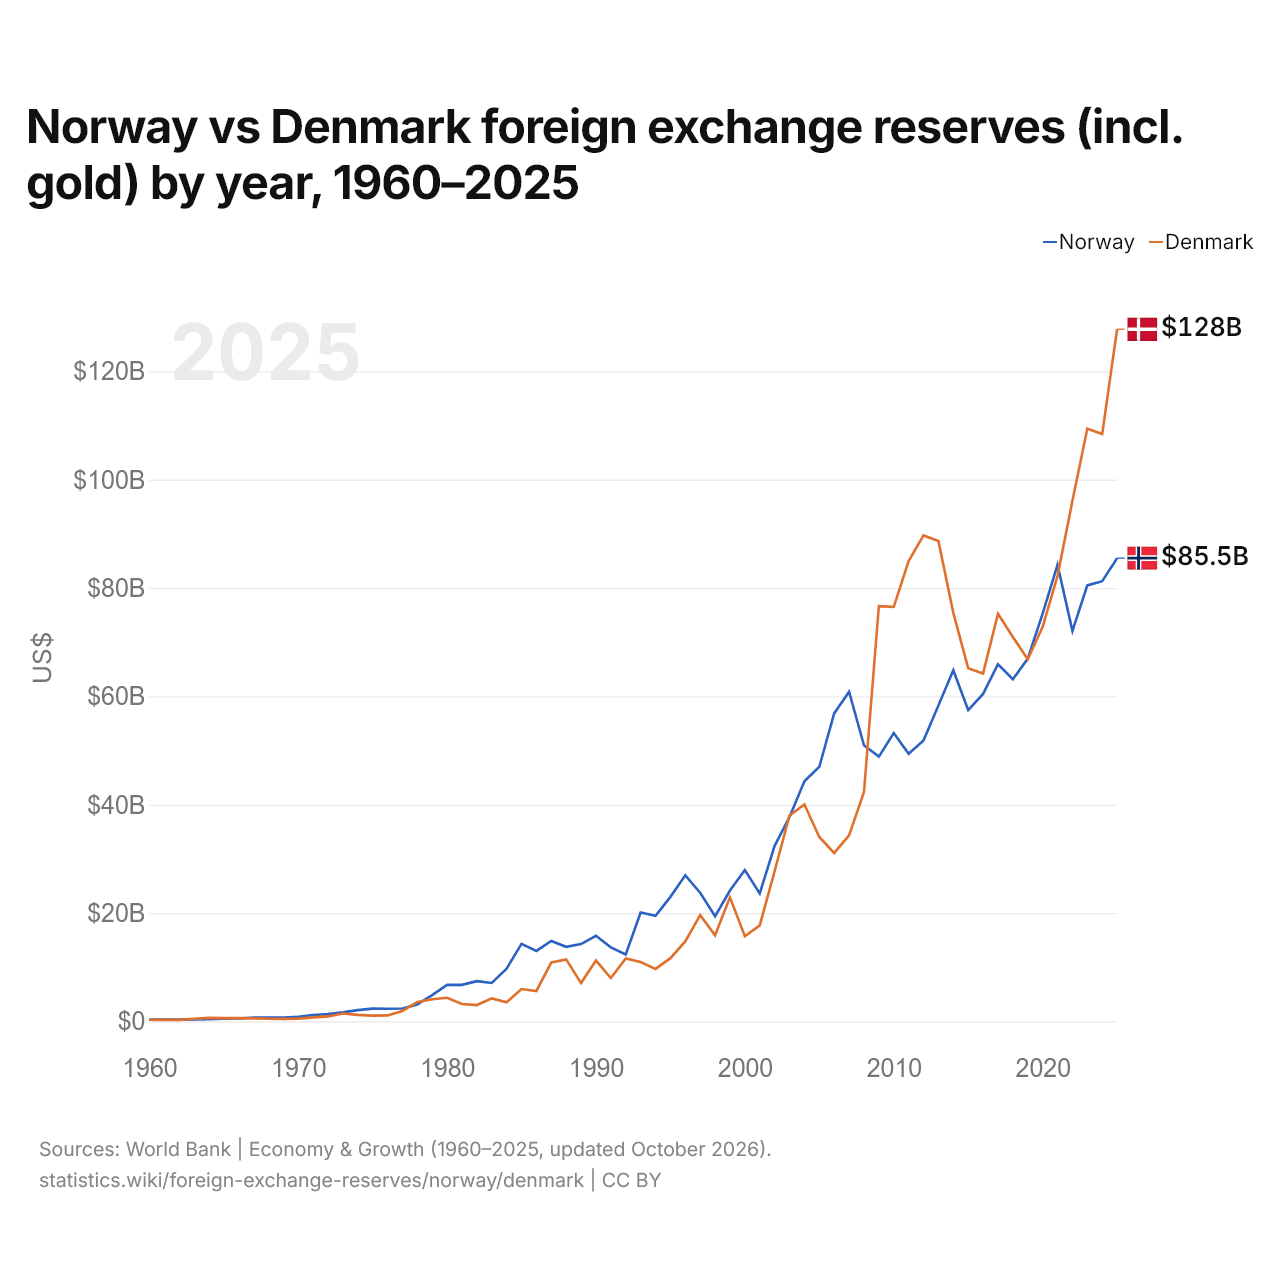
Noruega vs Dinamarca: reservas de divisas (incluido el oro) por año, 1960–2025
1x
| Año | US$ | |
|---|---|---|
 Noruega |
 Dinamarca |
|
| 2025 | 85.494.772.694 US$ | 127.756.364.612 US$ |
| 2024 | 81.241.559.662 US$ | 108.405.100.883 US$ |
| 2023 | 80.459.096.008 US$ | 109.370.841.824 US$ |
| 2022 | 72.077.375.479 US$ | 96.072.552.269 US$ |
| 2021 | 84.270.941.751 US$ | 82.235.844.736 US$ |
| 2020 | 75.258.813.465 US$ | 72.823.350.927 US$ |
| 2019 | 66.946.037.550 US$ | 66.835.547.934 US$ |
| 2018 | 63.145.471.060 US$ | 70.942.078.374 US$ |
| 2017 | 65.923.863.904 US$ | 75.244.445.866 US$ |
| 2016 | 60.445.172.370 US$ | 64.215.805.620 US$ |
| 2015 | 57.455.936.482 US$ | 65.185.093.406 US$ |
| 2014 | 64.800.723.857 US$ | 75.391.887.669 US$ |
| 2013 | 58.283.142.155 US$ | 88.676.584.007 US$ |
| 2012 | 51.856.399.588 US$ | 89.697.829.678 US$ |
| 2011 | 49.397.087.253 US$ | 84.955.222.078 US$ |
| 2010 | 53.215.083.706 US$ | 76.510.022.326 US$ |
| 2009 | 48.859.300.062 US$ | 76.617.709.422 US$ |
| 2008 | 50.949.819.415 US$ | 42.326.707.927 US$ |
| 2007 | 60.839.629.829 US$ | 34.318.338.718 US$ |
| 2006 | 56.841.568.846 US$ | 31.083.835.098 US$ |
| 2005 | 46.985.905.052 US$ | 34.028.012.497 US$ |
| 2004 | 44.307.531.918 US$ | 40.020.822.397 US$ |
| 2003 | 37.712.335.260 US$ | 37.997.724.766 US$ |
| 2002 | 32.404.966.343 US$ | 27.719.142.484 US$ |
| 2001 | 23.604.634.336 US$ | 17.702.199.723 US$ |
| 2000 | 27.922.060.282 US$ | 15.695.951.233 US$ |
| 1999 | 24.150.928.580 US$ | 22.908.487.684 US$ |
| 1998 | 19.388.853.820 US$ | 15.880.864.795 US$ |
| 1997 | 23.743.940.555 US$ | 19.613.799.547 US$ |
| 1996 | 26.953.896.228 US$ | 14.754.070.655 US$ |
| 1995 | 22.975.738.604 US$ | 11.652.290.058 US$ |
| 1994 | 19.479.286.660 US$ | 9.680.246.577 US$ |
| 1993 | 20.084.954.186 US$ | 10.941.474.547 US$ |
| 1992 | 12.334.939.898 US$ | 11.596.802.127 US$ |
| 1991 | 13.650.691.818 US$ | 7.990.191.790 US$ |
| 1990 | 15.788.119.114 US$ | 11.225.840.672 US$ |
| 1989 | 14.259.623.107 US$ | 7.053.627.355 US$ |
| 1988 | 13.753.480.639 US$ | 11.433.249.793 US$ |
| 1987 | 14.849.725.175 US$ | 10.854.481.762 US$ |
| 1986 | 12.987.382.962 US$ | 5.601.249.773 US$ |
| 1985 | 14.303.907.455 US$ | 5.961.248.202 US$ |
| 1984 | 9.730.069.918 US$ | 3.511.129.161 US$ |
| 1983 | 7.080.876.679 US$ | 4.242.152.680 US$ |
| 1982 | 7.414.476.975 US$ | 3.009.958.068 US$ |
| 1981 | 6.723.509.093 US$ | 3.195.167.219 US$ |
| 1980 | 6.745.966.631 US$ | 4.347.048.285 US$ |
| 1979 | 4.821.442.649 US$ | 4.075.276.491 US$ |
| 1978 | 3.116.741.416 US$ | 3.576.473.669 US$ |
| 1977 | 2.373.917.180 US$ | 1.906.323.391 US$ |
| 1976 | 2.321.348.340 US$ | 1.085.798.462 US$ |
| 1975 | 2.333.773.000 US$ | 1.056.989.138 US$ |
| 1974 | 2.069.214.569 US$ | 1.195.732.106 US$ |
| 1973 | 1.643.357.567 US$ | 1.450.865.798 US$ |
| 1972 | 1.351.223.544 US$ | 903.602.411 US$ |
| 1971 | 1.159.714.543 US$ | 732.048.348 US$ |
| 1970 | 812.917.900 US$ | 487.940.280 US$ |
| 1969 | 710.409.600 US$ | 446.662.400 US$ |
| 1968 | 707.150.100 US$ | 471.330.200 US$ |
| 1967 | 677.214.400 US$ | 535.507.200 US$ |
| 1966 | 527.729.180 US$ | 597.676.340 US$ |
| 1965 | 476.020.480 US$ | 587.293.840 US$ |
| 1964 | 387.005.120 US$ | 645.440.720 US$ |
| 1963 | 353.954.840 US$ | 470.635.320 US$ |
| 1962 | 303.975.970 US$ | 255.803.820 US$ |
| 1961 | 303.430.200 US$ | 282.882.350 US$ |
| 1960 | 308.178.400 US$ | 287.547.600 US$ |
En 2025, las reservas de divisas de Noruega fueron de 85,5 mil millones de US$ y las de Dinamarca, de 128 mil millones de US$: las de Dinamarca fueron un 49 % mayores. En 1960, las reservas de Noruega fueron un 7,2 % mayores: 308 millones de US$ de Noruega y 288 millones de US$ de Dinamarca.
Las reservas de divisas de Dinamarca han sido mayores que las de Noruega todos los años desde 2022.
Noruega vs Dinamarca: reservas, incluido el oro, y meses de importaciones cubiertos
|
Noruega
|
Dinamarca
|
|
|---|---|---|
| Reservas, incluido el oro | 85,5 mil M US$ | 128 mil M US$ |
| Meses de importaciones | 5,7 | 5,6 |
| Puesto mundial | 34/168 | 24/168 |
| Diferencia de reservas | 0,67× | 1,5× |
Comparar las reservas de divisas de 2 países cualesquiera
Fuentes:
- Banco Mundial | Economía y crecimiento (1960–2025, actualizado en octubre de 2026)
Creative Commons Atribución (CC BY): puedes copiar, compartir, adaptar y reutilizar este contenido, también con fines comerciales, siempre que cites a statistics.wiki e indiques los cambios que hayas hecho. Las fuentes indicadas arriba pueden tener sus propias condiciones de licencia.