
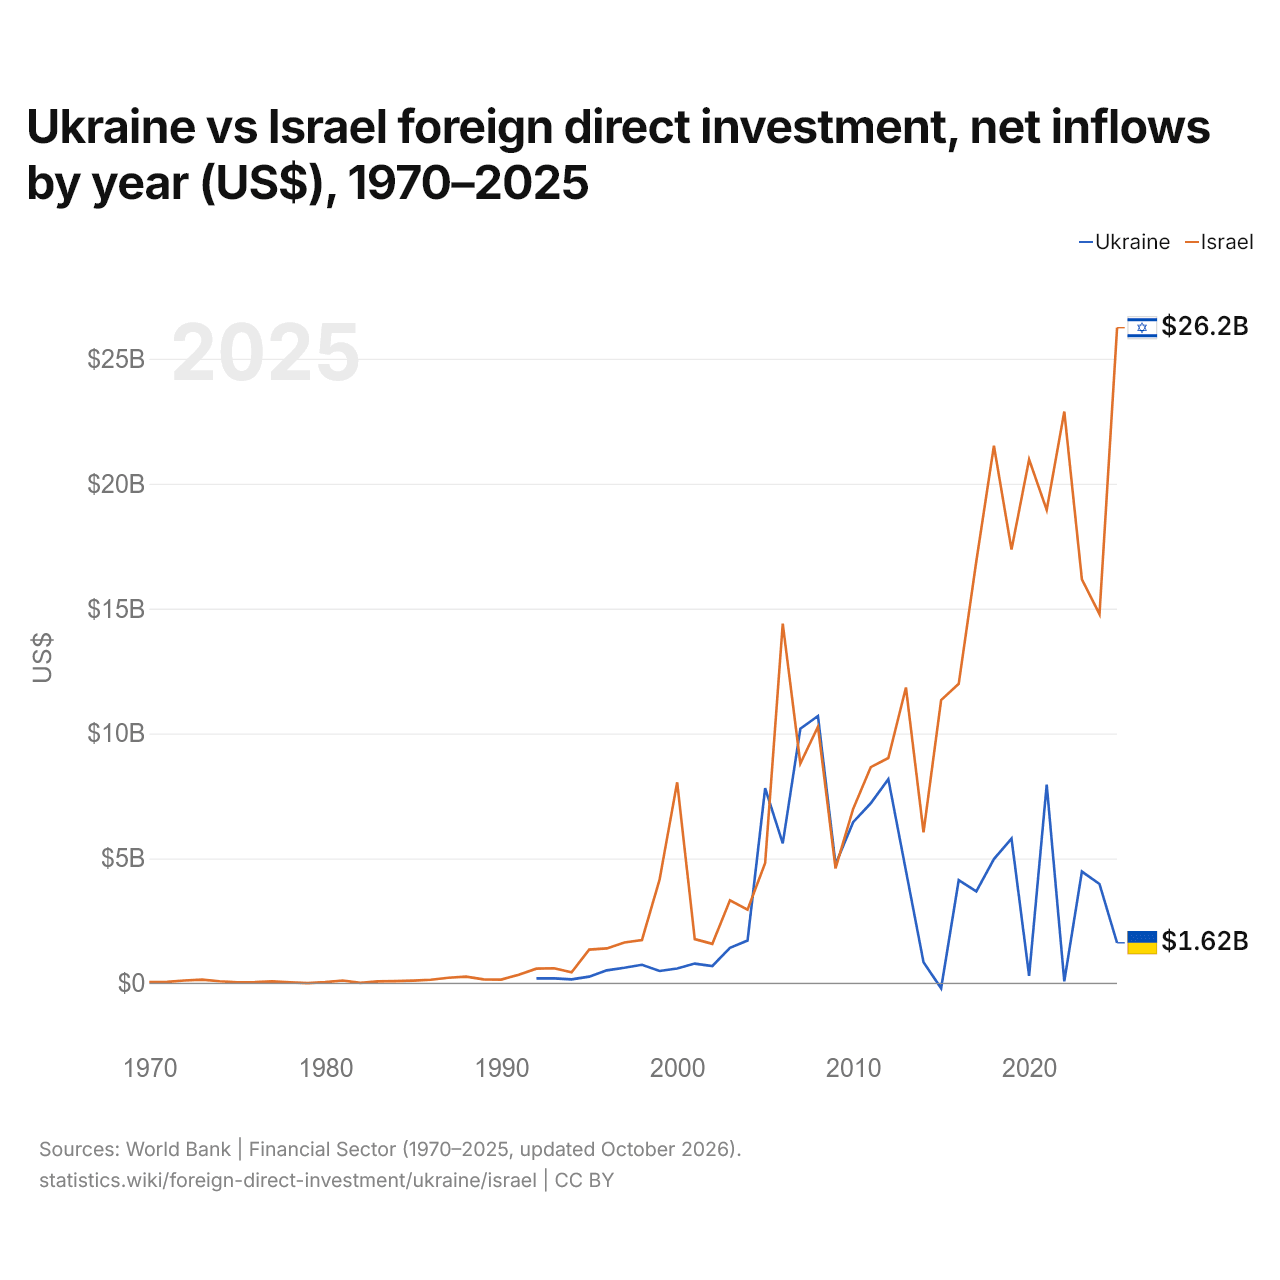
Ucrania vs Israel: inversión extranjera directa, entradas netas por año (US$), 1970–2025
| Año | US$ | |
|---|---|---|
 Ucrania |
 Israel |
|
| 2025 | 1.623.000.000 US$ | 26.242.100.000 US$ |
| 2024 | 3.977.000.000 US$ | 14.777.900.000 US$ |
| 2023 | 4.474.000.000 US$ | 16.170.300.000 US$ |
| 2022 | 82.000.000 US$ | 22.883.500.000 US$ |
| 2021 | 7.954.000.000 US$ | 18.949.900.000 US$ |
| 2020 | 304.000.000 US$ | 20.968.700.000 US$ |
| 2019 | 5.796.000.000 US$ | 17.362.500.000 US$ |
| 2018 | 4.975.000.000 US$ | 21.514.500.000 US$ |
| 2017 | 3.680.000.000 US$ | 16.892.500.000 US$ |
| 2016 | 4.128.000.000 US$ | 11.988.000.000 US$ |
| 2015 | −198.000.000 US$ | 11.336.200.000 US$ |
| 2014 | 847.000.000 US$ | 6.048.900.000 US$ |
| 2013 | 4.509.000.000 US$ | 11.842.200.000 US$ |
| 2012 | 8.175.000.000 US$ | 9.017.300.000 US$ |
| 2011 | 7.207.000.000 US$ | 8.653.000.000 US$ |
| 2010 | 6.451.000.000 US$ | 6.984.700.000 US$ |
| 2009 | 4.769.000.000 US$ | 4.606.900.000 US$ |
| 2008 | 10.700.000.000 US$ | 10.274.200.000 US$ |
| 2007 | 10.193.000.000 US$ | 8.798.100.000 US$ |
| 2006 | 5.604.000.000 US$ | 14.395.500.000 US$ |
| 2005 | 7.808.000.000 US$ | 4.818.400.000 US$ |
| 2004 | 1.715.000.000 US$ | 2.946.900.000 US$ |
| 2003 | 1.424.000.000 US$ | 3.322.000.000 US$ |
| 2002 | 693.000.000 US$ | 1.582.500.000 US$ |
| 2001 | 792.000.000 US$ | 1.771.300.000 US$ |
| 2000 | 595.000.000 US$ | 8.047.500.000 US$ |
| 1999 | 496.000.000 US$ | 4.150.000.000 US$ |
| 1998 | 743.000.000 US$ | 1.737.400.000 US$ |
| 1997 | 623.000.000 US$ | 1.633.800.000 US$ |
| 1996 | 521.000.000 US$ | 1.397.100.000 US$ |
| 1995 | 267.000.000 US$ | 1.350.300.000 US$ |
| 1994 | 159.000.000 US$ | 441.600.000 US$ |
| 1993 | 200.000.000 US$ | 604.900.000 US$ |
| 1992 | 200.000.000 US$ | 588.500.000 US$ |
| 1991 | - | 345.600.000 US$ |
| 1990 | - | 151.000.000 US$ |
| 1989 | - | 160.400.000 US$ |
| 1988 | - | 267.200.000 US$ |
| 1987 | - | 224.100.000 US$ |
| 1986 | - | 143.400.000 US$ |
| 1985 | - | 112.300.000 US$ |
| 1984 | - | 89.500.000 US$ |
| 1983 | - | 78.500.000 US$ |
| 1982 | - | 21.300.000 US$ |
| 1981 | - | 114.400.000 US$ |
| 1980 | - | 51.000.000 US$ |
| 1979 | - | 11.000.000 US$ |
| 1978 | - | 39.000.000 US$ |
| 1977 | - | 81.000.000 US$ |
| 1976 | - | 47.000.000 US$ |
| 1975 | - | 45.000.000 US$ |
| 1974 | - | 84.000.000 US$ |
| 1973 | - | 149.000.000 US$ |
| 1972 | - | 114.000.000 US$ |
| 1971 | - | 57.000.000 US$ |
| 1970 | - | 49.000.000 US$ |
En 2025, las entradas netas de inversión extranjera directa fueron de 1,62 mil millones de US$ en Ucrania y de 26,2 mil millones de US$ en Israel: 16 veces más en Israel. En 1992, fueron de 200 millones de US$ en Ucrania y de 589 millones de US$ en Israel.
Las entradas netas de inversión extranjera directa en Ucrania fueron mayores que en Israel en 4 de los 34 años de 1992 a 2025, y menores en 30.
Ucrania vs Israel: últimas entradas y salidas de inversión extranjera
|
Ucrania
|
Israel
|
|
|---|---|---|
| Entradas netas | +1620 M US$ | +26,2 mil M US$ |
| Entradas netas, % del PIB | +0,8 % | +4,3 % |
| Salidas netas | −109 M US$ | +14,7 mil M US$ |
| Entradas netas, total 2016–2025 | +37,0 mil M US$ | +188 mil M US$ |
| Puesto mundial | 79/192 | 18/192 |
Comparar la inversión extranjera directa de 2 países cualesquiera
Fuentes:
- Banco Mundial | Sector financiero (1970–2025, actualizado en octubre de 2026)
Creative Commons Atribución (CC BY): puedes copiar, compartir, adaptar y reutilizar este contenido, también con fines comerciales, siempre que cites a statistics.wiki e indiques los cambios que hayas hecho. Las fuentes indicadas arriba pueden tener sus propias condiciones de licencia.