
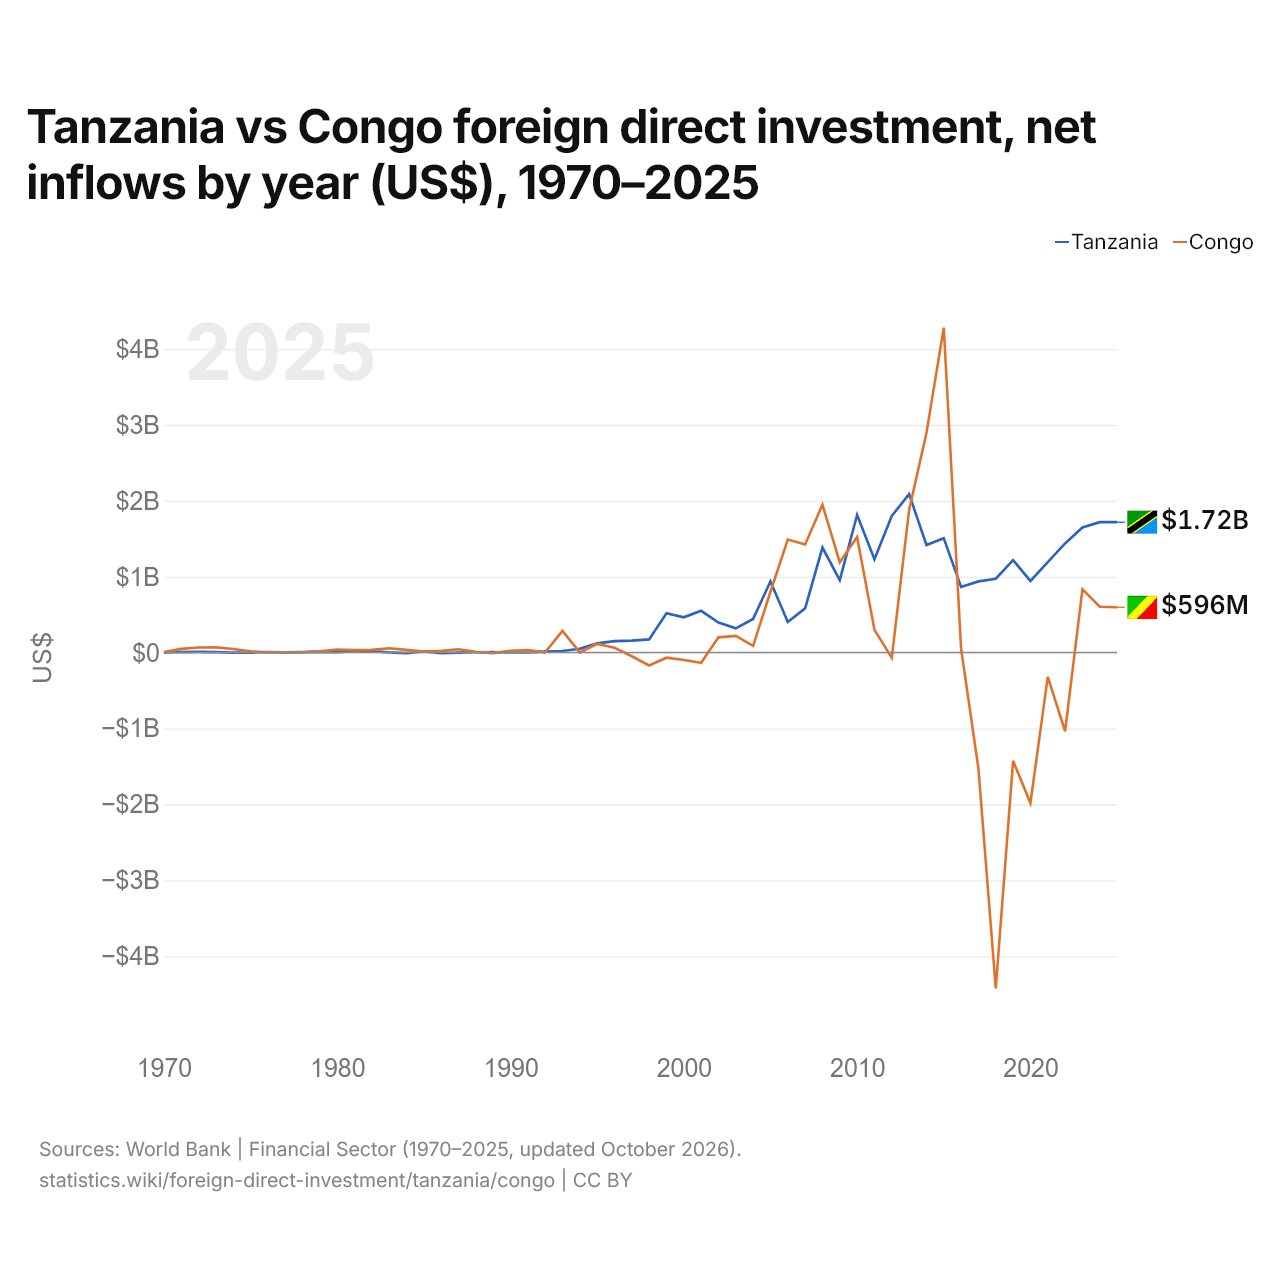
Tanzania vs República del Congo: inversión extranjera directa, entradas netas por año (US$), 1970–2025
| Año | US$ | |
|---|---|---|
 Tanzania |
 Congo (Rep.) |
|
| 2025 | 1.717.575.170 US$ | 596.293.207 US$ |
| 2024 | 1.717.575.169 US$ | 603.616.456 US$ |
| 2023 | 1.648.913.856 US$ | 833.597.455 US$ |
| 2022 | 1.437.575.169 US$ | −1.036.745.399 US$ |
| 2021 | 1.190.507.399 US$ | −320.209.518 US$ |
| 2020 | 943.765.262 US$ | −1.983.178.867 US$ |
| 2019 | 1.217.235.252 US$ | −1.427.679.257 US$ |
| 2018 | 971.576.866 US$ | −4.423.895.345 US$ |
| 2017 | 937.700.000 US$ | −1.530.284.458 US$ |
| 2016 | 864.040.000 US$ | 50.608.700 US$ |
| 2015 | 1.506.024.896 US$ | 4.279.839.199 US$ |
| 2014 | 1.416.088.065 US$ | 2.891.102.397 US$ |
| 2013 | 2.087.261.310 US$ | 1.878.859.499 US$ |
| 2012 | 1.799.646.137 US$ | −69.249.948 US$ |
| 2011 | 1.229.361.018 US$ | 298.678.855 US$ |
| 2010 | 1.813.200.000 US$ | 1.522.228.646 US$ |
| 2009 | 952.630.000 US$ | 1.189.051.286 US$ |
| 2008 | 1.383.260.000 US$ | 1.947.972.913 US$ |
| 2007 | 581.511.807 US$ | 1.424.251.936 US$ |
| 2006 | 403.038.991 US$ | 1.489.015.781 US$ |
| 2005 | 935.520.592 US$ | 801.314.934 US$ |
| 2004 | 442.539.548 US$ | 88.557.997 US$ |
| 2003 | 318.401.299 US$ | 220.038.914 US$ |
| 2002 | 395.567.134 US$ | 200.095.651 US$ |
| 2001 | 549.270.351 US$ | −135.479.673 US$ |
| 2000 | 463.400.859 US$ | −98.141.674 US$ |
| 1999 | 516.700.642 US$ | −68.298.652 US$ |
| 1998 | 172.306.245 US$ | −169.664.716 US$ |
| 1997 | 157.885.064 US$ | −49.200.800 US$ |
| 1996 | 150.066.382 US$ | 62.427.619 US$ |
| 1995 | 119.936.654 US$ | 112.782.085 US$ |
| 1994 | 50.000.895 US$ | 2.990.000 US$ |
| 1993 | 20.457.764 US$ | 286.054.322 US$ |
| 1992 | 12.169.639 US$ | 2.739.033 US$ |
| 1991 | 10.000 US$ | 32.753.530 US$ |
| 1990 | 10.000 US$ | 22.551.558 US$ |
| 1989 | 5.840.000 US$ | −7.125.213 US$ |
| 1988 | 3.760.000 US$ | 9.095.237 US$ |
| 1987 | −470.000 US$ | 43.448.956 US$ |
| 1986 | −7.490.000 US$ | 22.439.698 US$ |
| 1985 | 14.510.000 US$ | 12.689.673 US$ |
| 1984 | −8.420.000 US$ | 34.948.546 US$ |
| 1983 | 1.520.000 US$ | 56.079.519 US$ |
| 1982 | 17.310.000 US$ | 35.349.297 US$ |
| 1981 | 18.920.000 US$ | 30.842.951 US$ |
| 1980 | 4.580.000 US$ | 40.032.269 US$ |
| 1979 | 8.020.000 US$ | 16.481.633 US$ |
| 1978 | 6.120.000 US$ | 4.050.416 US$ |
| 1977 | 2.940.000 US$ | 1.986.324 US$ |
| 1976 | 6.560.000 US$ | 2.380.000 US$ |
| 1975 | −870.000 US$ | 15.400.000 US$ |
| 1974 | −2.060.000 US$ | 46.100.000 US$ |
| 1973 | 6.030.000 US$ | 68.300.000 US$ |
| 1972 | 7.690.000 US$ | 66.300.000 US$ |
| 1971 | 5.150.000 US$ | 48.700.000 US$ |
| 1970 | 3.070.000 US$ | 5.100.000 US$ |
En 2025, las entradas netas de inversión extranjera directa fueron de 1,72 mil millones de US$ en Tanzania y de 596 millones de US$ en la República del Congo: 2,9 veces más en Tanzania. En 1970, fueron de 3,07 millones de US$ en Tanzania y de 5,1 millones de US$ en la República del Congo.
Las entradas netas de inversión extranjera directa en Tanzania fueron mayores que en la República del Congo en 32 de los 56 años de 1970 a 2025, y menores en 24.
Tanzania vs República del Congo: últimas entradas y salidas de inversión extranjera
|
Tanzania
|
Congo (Rep.)
|
|
|---|---|---|
| Entradas netas | +1720 M US$ | +596 M US$ |
| Entradas netas, % del PIB | +1,9 % | +3,7 % |
| Salidas netas | n/d | +93,3 M US$ (2025) |
| Entradas netas, total 2016–2025 | +12,6 mil M US$ | −8640 M US$ |
| Puesto mundial | 74/192 | 113/192 |
Comparar la inversión extranjera directa de 2 países cualesquiera
Fuentes:
- Banco Mundial | Sector financiero (1970–2025, actualizado en octubre de 2026)
Creative Commons Atribución (CC BY): puedes copiar, compartir, adaptar y reutilizar este contenido, también con fines comerciales, siempre que cites a statistics.wiki e indiques los cambios que hayas hecho. Las fuentes indicadas arriba pueden tener sus propias condiciones de licencia.