
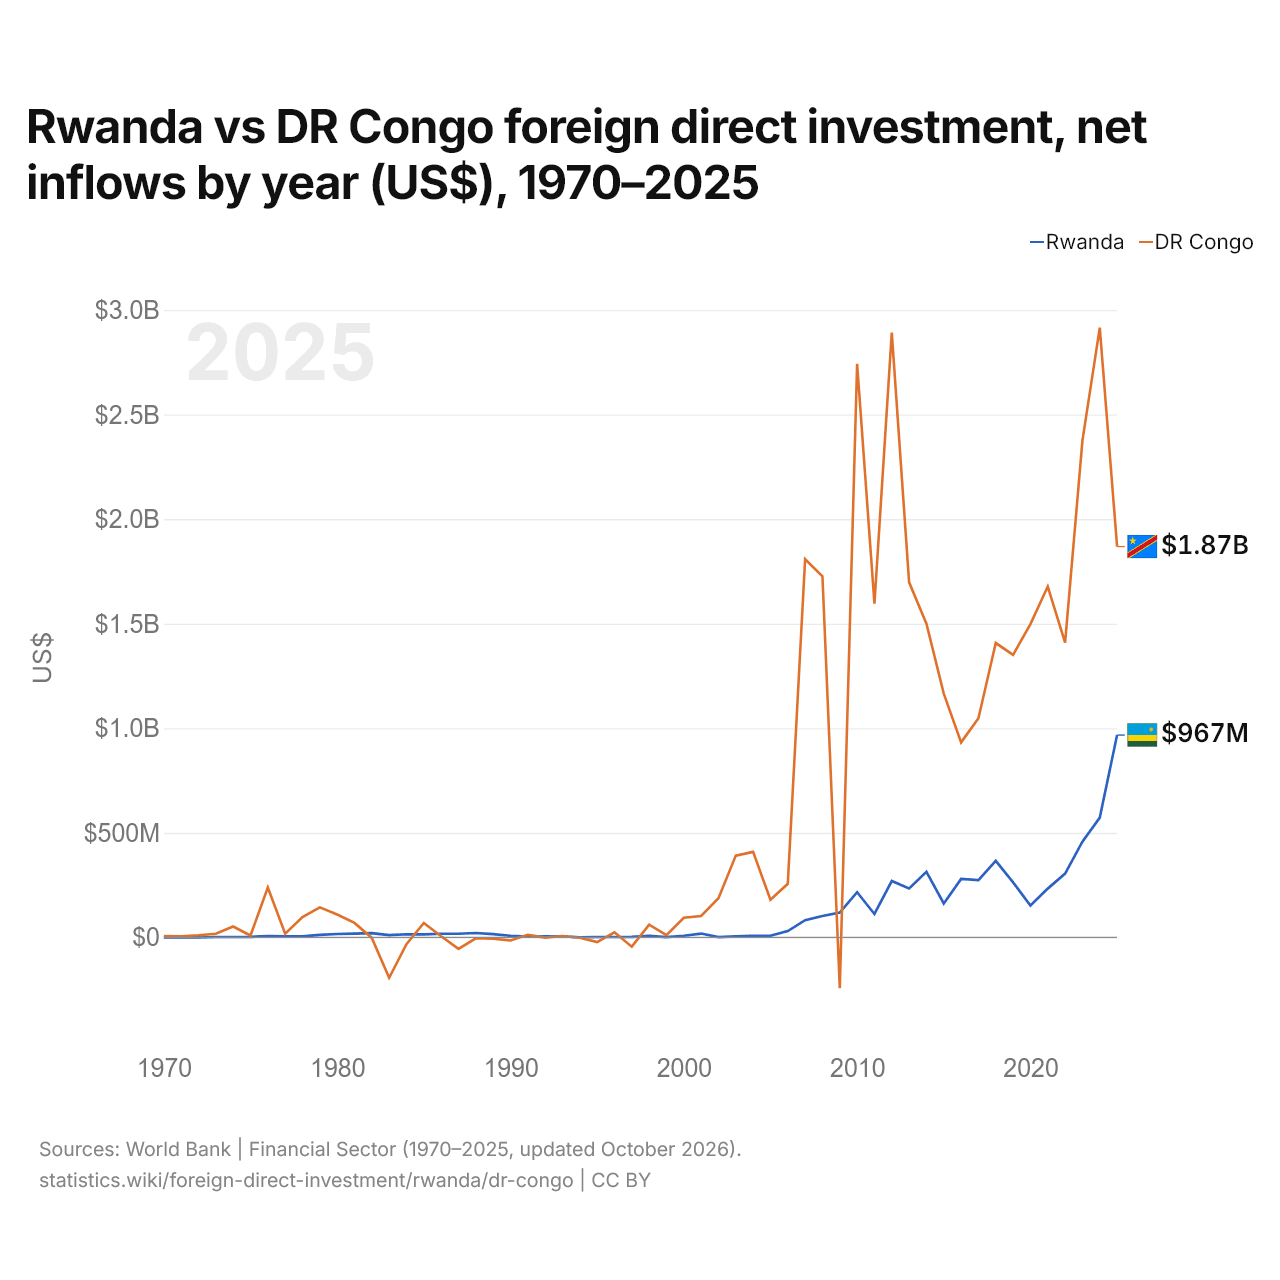
Ruanda vs República Democrática del Congo: inversión extranjera directa, entradas netas por año (US$), 1970–2025
| Año | US$ | |
|---|---|---|
 Ruanda |
 RDC |
|
| 2025 | 967.463.915 US$ | 1.868.633.534 US$ |
| 2024 | 572.929.300 US$ | 2.915.055.323 US$ |
| 2023 | 457.644.003 US$ | 2.375.258.887 US$ |
| 2022 | 305.101.863 US$ | 1.409.373.842 US$ |
| 2021 | 233.384.939 US$ | 1.677.673.790 US$ |
| 2020 | 152.614.121 US$ | 1.498.084.808 US$ |
| 2019 | 263.172.335 US$ | 1.350.994.226 US$ |
| 2018 | 366.192.316 US$ | 1.407.563.588 US$ |
| 2017 | 274.025.991 US$ | 1.047.979.483 US$ |
| 2016 | 279.747.328 US$ | 932.374.669 US$ |
| 2015 | 162.083.821 US$ | 1.165.720.010 US$ |
| 2014 | 313.997.163 US$ | 1.499.572.152 US$ |
| 2013 | 233.763.794 US$ | 1.697.585.831 US$ |
| 2012 | 269.615.550 US$ | 2.891.607.809 US$ |
| 2011 | 112.127.536 US$ | 1.596.024.304 US$ |
| 2010 | 216.192.557 US$ | 2.742.300.000 US$ |
| 2009 | 118.670.000 US$ | −243.200.000 US$ |
| 2008 | 102.290.000 US$ | 1.726.800.000 US$ |
| 2007 | 82.283.166 US$ | 1.808.000.000 US$ |
| 2006 | 30.643.966 US$ | 256.100.000 US$ |
| 2005 | 7.960.000 US$ | 180.000.000 US$ |
| 2004 | 7.700.000 US$ | 409.032.814 US$ |
| 2003 | 4.700.000 US$ | 391.254.724 US$ |
| 2002 | 1.500.000 US$ | 187.598.694 US$ |
| 2001 | 18.500.000 US$ | 102.221.900 US$ |
| 2000 | 8.100.000 US$ | 94.190.400 US$ |
| 1999 | 1.740.000 US$ | 11.160.000 US$ |
| 1998 | 7.100.000 US$ | 61.330.000 US$ |
| 1997 | 2.590.000 US$ | −44.350.000 US$ |
| 1996 | 2.220.000 US$ | 24.790.000 US$ |
| 1995 | 2.000.000 US$ | −22.350.000 US$ |
| 1994 | 1.000 US$ | −1.500.000 US$ |
| 1993 | 5.840.000 US$ | 6.870.000 US$ |
| 1992 | 5.500.000 US$ | −730.000 US$ |
| 1991 | 4.580.000 US$ | 12.390.000 US$ |
| 1990 | 7.660.000 US$ | −14.460.000 US$ |
| 1989 | 15.540.000 US$ | −6.110.000 US$ |
| 1988 | 21.050.000 US$ | −3.940.000 US$ |
| 1987 | 17.550.000 US$ | −55.080.000 US$ |
| 1986 | 17.580.000 US$ | 5.550.000 US$ |
| 1985 | 14.620.000 US$ | 69.190.000 US$ |
| 1984 | 15.070.000 US$ | −32.450.000 US$ |
| 1983 | 11.120.000 US$ | −192.790.000 US$ |
| 1982 | 20.700.000 US$ | −2.370.000 US$ |
| 1981 | 18.030.000 US$ | 69.630.000 US$ |
| 1980 | 16.420.000 US$ | 109.620.000 US$ |
| 1979 | 12.570.000 US$ | 143.850.000 US$ |
| 1978 | 4.690.000 US$ | 97.680.000 US$ |
| 1977 | 4.950.000 US$ | 18.190.000 US$ |
| 1976 | 5.860.000 US$ | 238.430.000 US$ |
| 1975 | 3.000.000 US$ | 9.120.000 US$ |
| 1974 | 2.200.000 US$ | 51.980.000 US$ |
| 1973 | 2.000.000 US$ | 17.720.000 US$ |
| 1972 | 500.000 US$ | 10.470.000 US$ |
| 1971 | 1.700.000 US$ | 5.740.000 US$ |
| 1970 | 60.000 US$ | 6.430.000 US$ |
En 2025, las entradas netas de inversión extranjera directa fueron de 967 millones de US$ en Ruanda y de 1,87 mil millones de US$ en la República Democrática del Congo: 1,9 veces más en la República Democrática del Congo. En 1970, fueron de 60.000 US$ en Ruanda y de 6,43 millones de US$ en la República Democrática del Congo.
Las entradas netas de inversión extranjera directa en Ruanda fueron mayores que en la República Democrática del Congo en 13 de los 56 años de 1970 a 2025, y menores en 43.
Ruanda vs República Democrática del Congo: últimas entradas y salidas de inversión extranjera
|
Ruanda
|
RDC
|
|
|---|---|---|
| Entradas netas | +967 M US$ | +1870 M US$ |
| Entradas netas, % del PIB | +5,9 % | +2,1 % |
| Salidas netas | +13,7 M US$ | +365 M US$ |
| Entradas netas, total 2016–2025 | +3870 M US$ | +16,5 mil M US$ |
| Puesto mundial | 93/192 | 69/192 |
Comparar la inversión extranjera directa de 2 países cualesquiera
Fuentes:
- Banco Mundial | Sector financiero (1970–2025, actualizado en octubre de 2026)
Creative Commons Atribución (CC BY): puedes copiar, compartir, adaptar y reutilizar este contenido, también con fines comerciales, siempre que cites a statistics.wiki e indiques los cambios que hayas hecho. Las fuentes indicadas arriba pueden tener sus propias condiciones de licencia.