
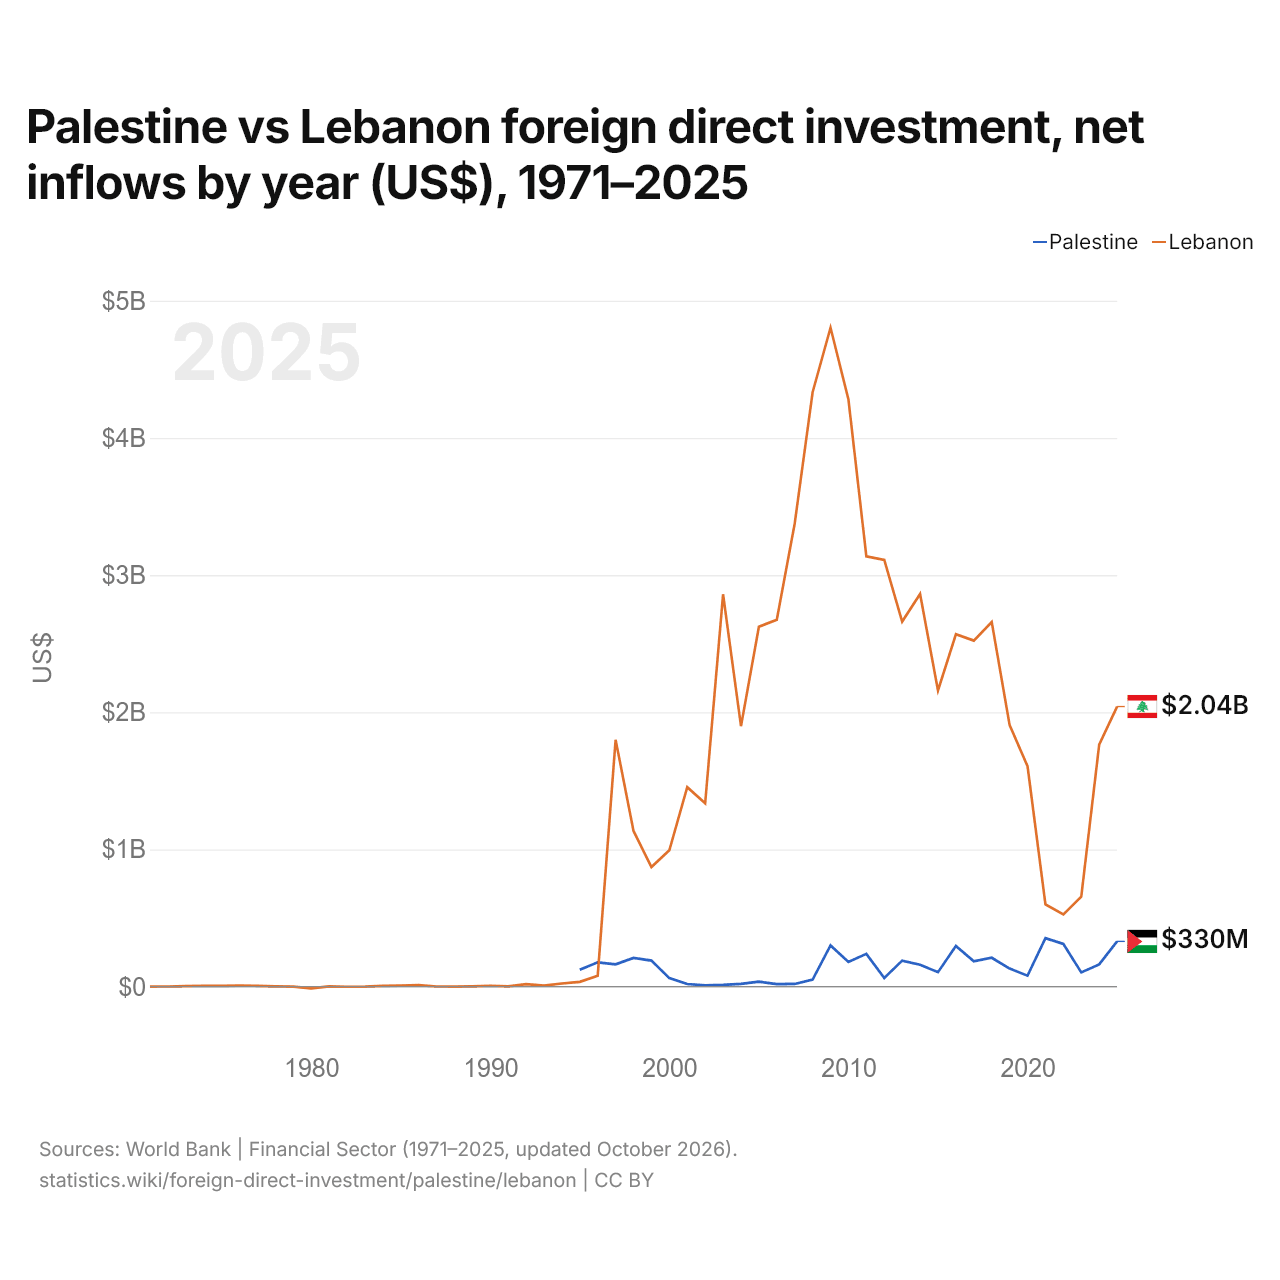
Palestina vs Líbano: inversión extranjera directa, entradas netas por año (US$), 1971–2025
| Año | US$ | |
|---|---|---|
 Palestina |
 Líbano |
|
| 2025 | 329.826.200 US$ | 2.041.796.982 US$ |
| 2024 | 162.176.714 US$ | 1.764.118.831 US$ |
| 2023 | 103.535.364 US$ | 655.437.382 US$ |
| 2022 | 310.825.494 US$ | 526.838.754 US$ |
| 2021 | 353.477.055 US$ | 599.788.271 US$ |
| 2020 | 79.744.992 US$ | 1.606.894.722 US$ |
| 2019 | 131.879.984 US$ | 1.906.392.482 US$ |
| 2018 | 210.694.556 US$ | 2.658.003.845 US$ |
| 2017 | 183.950.643 US$ | 2.522.409.653 US$ |
| 2016 | 296.473.531 US$ | 2.568.485.071 US$ |
| 2015 | 104.937.727 US$ | 2.159.289.952 US$ |
| 2014 | 159.711.665 US$ | 2.862.509.427 US$ |
| 2013 | 189.560.177 US$ | 2.661.087.128 US$ |
| 2012 | 62.985.366 US$ | 3.111.315.000 US$ |
| 2011 | 238.840.691 US$ | 3.137.050.288 US$ |
| 2010 | 179.941.048 US$ | 4.279.880.835 US$ |
| 2009 | 300.468.000 US$ | 4.803.602.660 US$ |
| 2008 | 51.508.000 US$ | 4.333.045.470 US$ |
| 2007 | 19.596.000 US$ | 3.375.980.758 US$ |
| 2006 | 18.587.960 US$ | 2.674.534.372 US$ |
| 2005 | 36.242.000 US$ | 2.623.502.612 US$ |
| 2004 | 20.520.000 US$ | 1.898.780.570 US$ |
| 2003 | 12.872.000 US$ | 2.860.020.313 US$ |
| 2002 | 9.440.000 US$ | 1.335.970.000 US$ |
| 2001 | 19.176.401 US$ | 1.453.907.497 US$ |
| 2000 | 62.005.482 US$ | 993.475.429 US$ |
| 1999 | 189.721.782 US$ | 871.676.542 US$ |
| 1998 | 208.973.105 US$ | 1.134.903.121 US$ |
| 1997 | 163.000.000 US$ | 1.799.600.000 US$ |
| 1996 | 177.200.000 US$ | 80.000.000 US$ |
| 1995 | 122.600.000 US$ | 35.000.000 US$ |
| 1994 | - | 22.560.000 US$ |
| 1993 | - | 7.400.000 US$ |
| 1992 | - | 18.460.000 US$ |
| 1991 | - | 1.630.000 US$ |
| 1990 | - | 6.450.000 US$ |
| 1989 | - | 1.590.000 US$ |
| 1988 | - | −270.000 US$ |
| 1987 | - | 1.250.000 US$ |
| 1986 | - | 10.480.000 US$ |
| 1985 | - | 6.930.000 US$ |
| 1984 | - | 5.070.000 US$ |
| 1983 | - | 600.000 US$ |
| 1982 | - | −670.000 US$ |
| 1981 | - | 1.660.000 US$ |
| 1980 | - | −12.160.000 US$ |
| 1979 | - | 290.000 US$ |
| 1978 | - | 2.230.000 US$ |
| 1977 | - | 6.100.000 US$ |
| 1976 | - | 7.490.000 US$ |
| 1975 | - | 5.040.000 US$ |
| 1974 | - | 6.340.000 US$ |
| 1973 | - | 3.950.000 US$ |
| 1972 | - | 760.000 US$ |
| 1971 | - | −80.000 US$ |
En 2025, las entradas netas de inversión extranjera directa fueron de 330 millones de US$ en Palestina y de 2,04 mil millones de US$ en Líbano: 6,2 veces más en Líbano. En 1995, fueron de 123 millones de US$ en Palestina y de 35 millones de US$ en Líbano.
Las entradas netas de inversión extranjera directa en Palestina fueron mayores que en Líbano en 2 de los 31 años de 1995 a 2025, y menores en 29.
Palestina vs Líbano: últimas entradas y salidas de inversión extranjera
|
Palestina
|
Líbano
|
|
|---|---|---|
| Entradas netas | +330 M US$ | +2040 M US$ |
| Entradas netas, % del PIB | +1,9 % | n/d |
| Salidas netas | +14,7 M US$ | +265 M US$ |
| Entradas netas, total 2016–2025 | +2160 M US$ | +16,9 mil M US$ |
| Puesto mundial | 124/192 | 64/192 |
Comparar la inversión extranjera directa de 2 países cualesquiera
Fuentes:
- Banco Mundial | Sector financiero (1971–2025, actualizado en octubre de 2026)
Creative Commons Atribución (CC BY): puedes copiar, compartir, adaptar y reutilizar este contenido, también con fines comerciales, siempre que cites a statistics.wiki e indiques los cambios que hayas hecho. Las fuentes indicadas arriba pueden tener sus propias condiciones de licencia.