
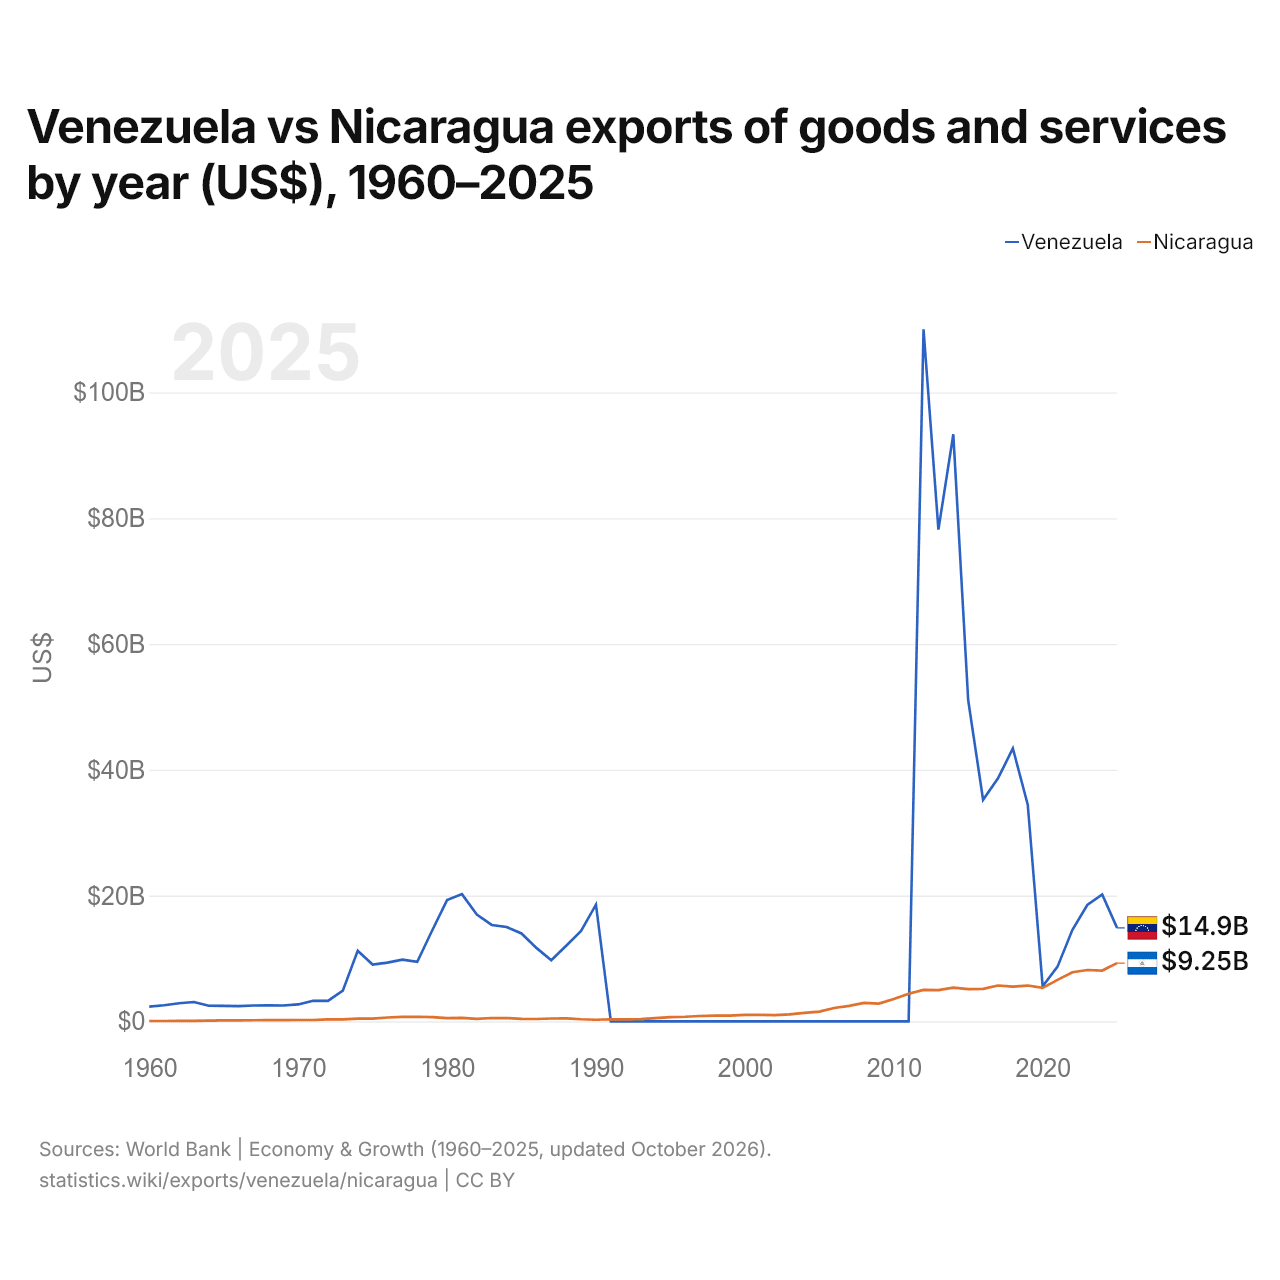
Venezuela vs Nicaragua: exportaciones de bienes y servicios por año (US$), 1960–2025
| Año | US$ | |
|---|---|---|
 Venezuela |
 Nicaragua |
|
| 2025 | 14.852.682.003 US$ | 9.249.209.962 US$ |
| 2024 | 20.176.779.559 US$ | 8.072.799.619 US$ |
| 2023 | 18.495.894.770 US$ | 8.166.793.679 US$ |
| 2022 | 14.552.860.356 US$ | 7.800.991.077 US$ |
| 2021 | 8.690.436.504 US$ | 6.593.588.346 US$ |
| 2020 | 5.571.267.854 US$ | 5.312.785.104 US$ |
| 2019 | 34.459.561.493 US$ | 5.689.725.119 US$ |
| 2018 | 43.392.568.659 US$ | 5.506.692.298 US$ |
| 2017 | 38.630.825.248 US$ | 5.698.946.073 US$ |
| 2016 | 35.237.270.127 US$ | 5.165.902.338 US$ |
| 2015 | 51.045.259.321 US$ | 5.113.365.846 US$ |
| 2014 | 93.349.895.633 US$ | 5.347.156.490 US$ |
| 2013 | 78.189.405.110 US$ | 4.965.877.905 US$ |
| 2012 | 110.049.401.395 US$ | 4.999.461.750 US$ |
| 2011 | 0 US$ | 4.400.107.700 US$ |
| 2010 | 0 US$ | 3.544.353.652 US$ |
| 2009 | 0 US$ | 2.820.023.106 US$ |
| 2008 | 0 US$ | 2.928.943.987 US$ |
| 2007 | 0 US$ | 2.454.433.020 US$ |
| 2006 | 0 US$ | 2.114.772.341 US$ |
| 2005 | 0 US$ | 1.541.273.560 US$ |
| 2004 | 0 US$ | 1.335.841.956 US$ |
| 2003 | 0 US$ | 1.101.967.322 US$ |
| 2002 | 0 US$ | 984.522.983 US$ |
| 2001 | 0 US$ | 1.019.075.853 US$ |
| 2000 | 0 US$ | 1.027.444.240 US$ |
| 1999 | 0 US$ | 899.835.239 US$ |
| 1998 | 0 US$ | 896.218.483 US$ |
| 1997 | 0 US$ | 852.512.885 US$ |
| 1996 | 0 US$ | 725.843.474 US$ |
| 1995 | 0 US$ | 666.412.218 US$ |
| 1994 | 0 US$ | 507.617.768 US$ |
| 1993 | 0 US$ | 358.807.190 US$ |
| 1992 | 0 US$ | 309.280.000 US$ |
| 1991 | 0 US$ | 324.886.598 US$ |
| 1990 | 18.555.857.828 US$ | 251.842.581 US$ |
| 1989 | 14.376.184.482 US$ | 329.660.036 US$ |
| 1988 | 12.017.951.724 US$ | 473.058.950 US$ |
| 1987 | 9.720.924.138 US$ | 453.312.553 US$ |
| 1986 | 11.675.344.330 US$ | 368.698.848 US$ |
| 1985 | 13.973.026.667 US$ | 396.280.490 US$ |
| 1984 | 15.003.121.140 US$ | 512.628.154 US$ |
| 1983 | 15.325.488.372 US$ | 534.109.825 US$ |
| 1982 | 16.968.302.326 US$ | 392.200.153 US$ |
| 1981 | 20.231.441.860 US$ | 552.951.120 US$ |
| 1980 | 19.286.255.814 US$ | 519.538.168 US$ |
| 1979 | 14.447.813.953 US$ | 658.777.312 US$ |
| 1978 | 9.474.348.837 US$ | 732.135.142 US$ |
| 1977 | 9.811.906.977 US$ | 714.673.957 US$ |
| 1976 | 9.339.325.581 US$ | 606.080.025 US$ |
| 1975 | 9.024.255.814 US$ | 443.524.241 US$ |
| 1974 | 11.207.186.047 US$ | 442.345.370 US$ |
| 1973 | 4.883.441.860 US$ | 308.310.585 US$ |
| 1972 | 3.254.954.545 US$ | 310.040.793 US$ |
| 1971 | 3.276.954.545 US$ | 217.911.328 US$ |
| 1970 | 2.688.022.222 US$ | 208.130.437 US$ |
| 1969 | 2.516.000.000 US$ | 182.894.687 US$ |
| 1968 | 2.537.488.889 US$ | 184.888.776 US$ |
| 1967 | 2.516.000.000 US$ | 173.891.684 US$ |
| 1966 | 2.429.977.778 US$ | 164.627.049 US$ |
| 1965 | 2.451.466.667 US$ | 165.339.903 US$ |
| 1964 | 2.471.908.046 US$ | 100.227.288 US$ |
| 1963 | 3.078.813.813 US$ | 85.701.582 US$ |
| 1962 | 2.880.107.474 US$ | 71.175.904 US$ |
| 1961 | 2.558.575.054 US$ | 57.134.379 US$ |
| 1960 | 2.332.409.504 US$ | 53.745.065 US$ |
En 2025, las exportaciones de bienes y servicios de Venezuela fueron de 14,9 mil millones de US$ y las de Nicaragua, de 9,25 mil millones de US$: las de Venezuela fueron 1,6 veces mayores. En 1960, las exportaciones de Venezuela fueron 43 veces mayores: 2,33 mil millones de US$ de Venezuela y 53,7 millones de US$ de Nicaragua.
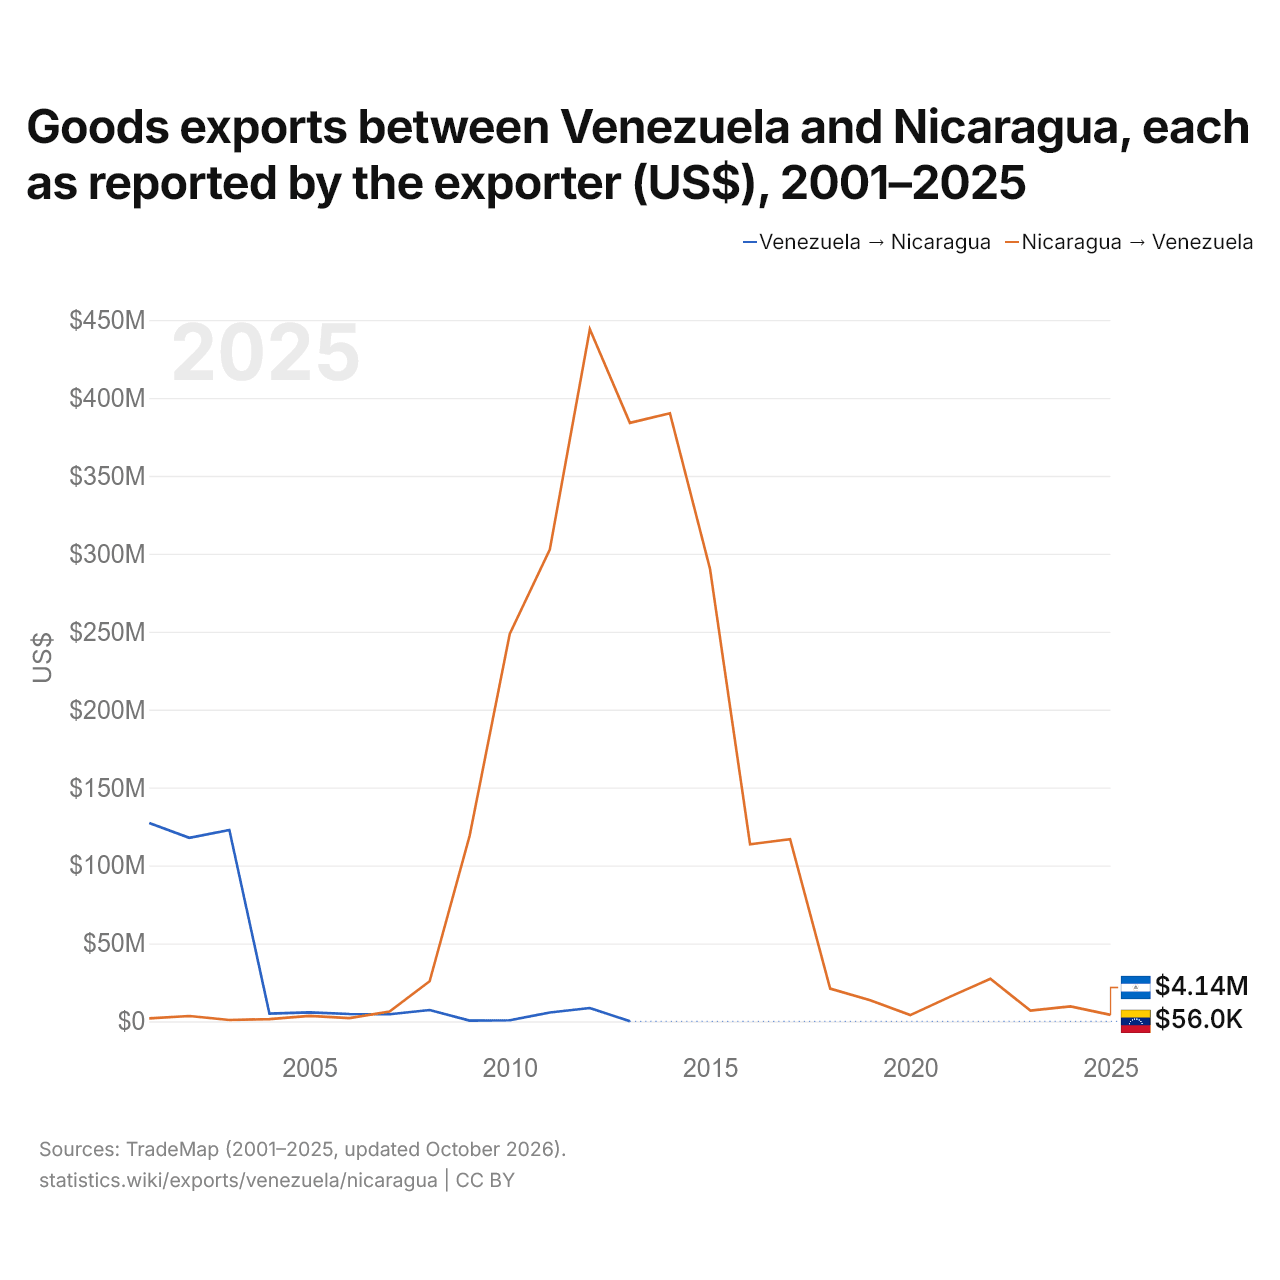
Exportaciones de bienes entre Venezuela y Nicaragua, según declara el exportador (US$), 2001–2025
| Año | US$ | |
|---|---|---|
| Venezuela → Nicaragua | Nicaragua → Venezuela | |
| 2025 | - | 4.135.000 US$ |
| 2024 | - | 9.568.000 US$ |
| 2023 | - | 6.863.000 US$ |
| 2022 | - | 27.291.000 US$ |
| 2021 | - | 15.865.000 US$ |
| 2020 | - | 3.989.000 US$ |
| 2019 | - | 13.549.000 US$ |
| 2018 | - | 21.037.000 US$ |
| 2017 | - | 116.820.000 US$ |
| 2016 | - | 113.617.000 US$ |
| 2015 | - | 290.340.000 US$ |
| 2014 | - | 390.095.000 US$ |
| 2013 | 56.000 US$ | 383.975.000 US$ |
| 2012 | 8.566.000 US$ | 444.026.000 US$ |
| 2011 | 5.636.000 US$ | 302.645.000 US$ |
| 2010 | 693.000 US$ | 248.569.000 US$ |
| 2009 | 480.000 US$ | 119.191.000 US$ |
| 2008 | 7.256.000 US$ | 25.687.000 US$ |
| 2007 | 4.554.000 US$ | 6.285.000 US$ |
| 2006 | 4.694.000 US$ | 2.061.000 US$ |
| 2005 | 5.780.000 US$ | 3.471.000 US$ |
| 2004 | 4.975.000 US$ | 1.404.000 US$ |
| 2003 | 122.798.000 US$ | 875.000 US$ |
| 2002 | 117.720.000 US$ | 3.435.000 US$ |
| 2001 | 127.303.000 US$ | 1.850.000 US$ |
Las exportaciones de bienes de Venezuela hacia Nicaragua, según Venezuela, fueron de 56.000 US$, y las de Nicaragua hacia Venezuela, según Nicaragua, de 384 millones de US$: 6900 veces más desde Nicaragua. En 2001, fueron de 127 millones de US$ desde Venezuela y de 1,85 millones de US$ desde Nicaragua.
Venezuela vs Nicaragua: cifras de exportaciones
|
Venezuela
|
Nicaragua
|
|
|---|---|---|
| Exportaciones | 14,9 mil M US$ (2025) | 9250 M US$ (2025) |
| Puesto mundial | 97/176 | 114/176 |
| Porcentaje del mundo | 0,04 % | 0,03 % |
| % del PIB | 14,9 % | 41,6 % |
| Mayor categoría de bienes | n/d | Metales preciosos, piedras preciosas, joyería, relojes, instrumentos musicales y arte (23 %, 2025) |
| Principal destino de bienes | n/d | Estados Unidos (46,1 %, 2025) |
Comparar las exportaciones de 2 países cualesquiera
Fuentes:
- Banco Mundial | Economía y crecimiento (1960–2025, actualizado en octubre de 2026)
- TradeMap (2001–2025, actualizado en octubre de 2026)
Creative Commons Atribución (CC BY): puedes copiar, compartir, adaptar y reutilizar este contenido, también con fines comerciales, siempre que cites a statistics.wiki e indiques los cambios que hayas hecho. Las fuentes indicadas arriba pueden tener sus propias condiciones de licencia.