
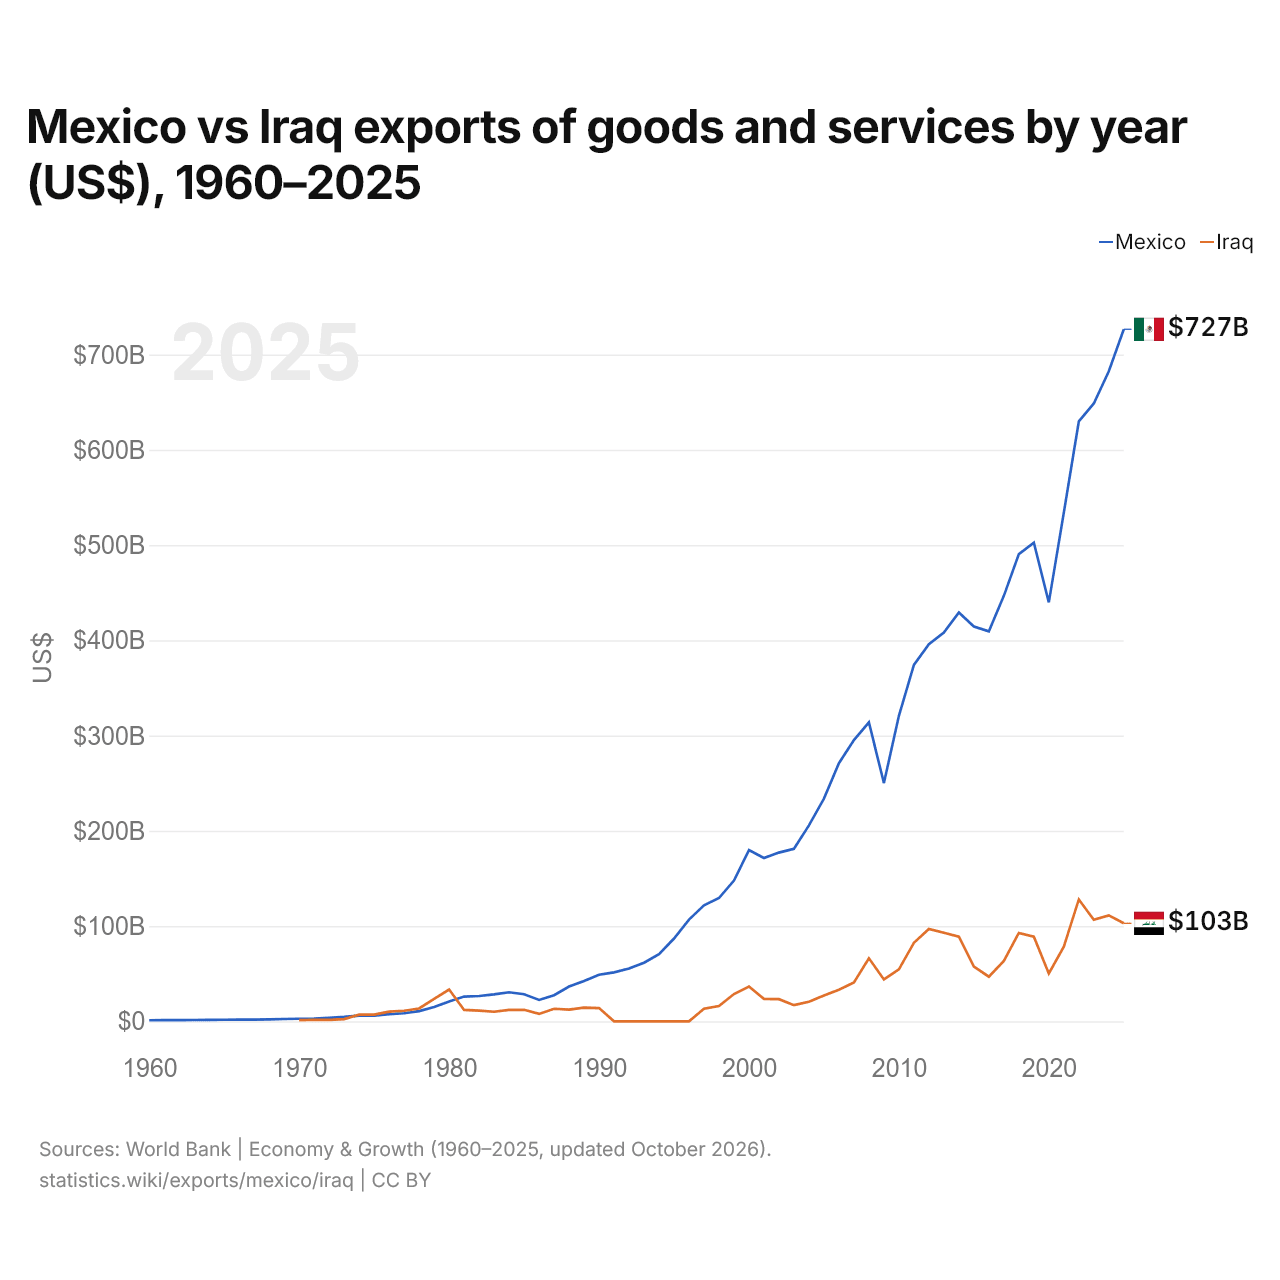
México vs Irak: exportaciones de bienes y servicios por año (US$), 1960–2025
| Año | US$ | |
|---|---|---|
 México |
 Irak |
|
| 2025 | 726.556.896.247 US$ | 102.917.700.000 US$ |
| 2024 | 682.472.609.894 US$ | 111.195.200.000 US$ |
| 2023 | 648.642.274.777 US$ | 106.560.874.026 US$ |
| 2022 | 629.788.673.074 US$ | 127.955.205.517 US$ |
| 2021 | 534.121.610.565 US$ | 78.260.500.000 US$ |
| 2020 | 439.853.932.828 US$ | 50.199.918.398 US$ |
| 2019 | 502.467.566.320 US$ | 88.902.900.000 US$ |
| 2018 | 490.508.969.545 US$ | 92.771.934.475 US$ |
| 2017 | 446.688.309.687 US$ | 63.496.860.304 US$ |
| 2016 | 409.476.294.705 US$ | 46.869.152.413 US$ |
| 2015 | 414.495.031.034 US$ | 57.560.658.811 US$ |
| 2014 | 429.314.956.761 US$ | 88.949.000.000 US$ |
| 2013 | 408.263.658.324 US$ | 93.065.600.000 US$ |
| 2012 | 395.854.929.793 US$ | 97.029.491.174 US$ |
| 2011 | 374.148.226.662 US$ | 82.505.400.000 US$ |
| 2010 | 320.766.037.581 US$ | 54.598.900.000 US$ |
| 2009 | 250.136.106.516 US$ | 43.993.209.758 US$ |
| 2008 | 313.852.456.087 US$ | 66.239.316.769 US$ |
| 2007 | 295.222.517.229 US$ | 40.776.066.436 US$ |
| 2006 | 270.928.816.793 US$ | 33.245.806.395 US$ |
| 2005 | 233.862.215.739 US$ | 27.209.318.291 US$ |
| 2004 | 205.711.767.188 US$ | 20.614.098.526 US$ |
| 2003 | 181.095.388.469 US$ | 16.965.698.641 US$ |
| 2002 | 177.144.829.752 US$ | 23.237.627.426 US$ |
| 2001 | 171.481.946.818 US$ | 23.613.582.831 US$ |
| 2000 | 179.810.168.051 US$ | 36.613.563.338 US$ |
| 1999 | 147.818.774.072 US$ | 28.632.988.389 US$ |
| 1998 | 129.452.220.228 US$ | 16.060.750.015 US$ |
| 1997 | 121.731.183.210 US$ | 13.257.740.143 US$ |
| 1996 | 106.842.978.990 US$ | 955.912 US$ |
| 1995 | 86.926.529.245 US$ | 693.281 US$ |
| 1994 | 70.611.769.311 US$ | 1.419.563 US$ |
| 1993 | 61.477.360.985 US$ | 779.621 US$ |
| 1992 | 55.406.062.494 US$ | 3.224.627 US$ |
| 1991 | 51.459.461.044 US$ | 5.262.248 US$ |
| 1990 | 48.866.118.135 US$ | 13.888.387.097 US$ |
| 1989 | 42.359.282.023 US$ | 14.460.000.000 US$ |
| 1988 | 36.496.678.772 US$ | 12.340.967.742 US$ |
| 1987 | 27.349.325.162 US$ | 13.184.193.548 US$ |
| 1986 | 22.446.879.807 US$ | 7.799.354.839 US$ |
| 1985 | 28.439.428.976 US$ | 12.176.451.613 US$ |
| 1984 | 30.521.772.291 US$ | 12.046.129.032 US$ |
| 1983 | 28.289.706.397 US$ | 10.023.870.968 US$ |
| 1982 | 26.632.371.193 US$ | 11.168.333.333 US$ |
| 1981 | 26.014.603.304 US$ | 11.959.333.333 US$ |
| 1980 | 20.850.899.743 US$ | 33.374.666.667 US$ |
| 1979 | 15.052.992.765 US$ | 23.617.676.939 US$ |
| 1978 | 10.748.302.367 US$ | 13.467.998.645 US$ |
| 1977 | 8.452.576.086 US$ | 11.148.662.377 US$ |
| 1976 | 7.545.416.829 US$ | 10.185.912.631 US$ |
| 1975 | 6.067.120.000 US$ | 7.042.668.473 US$ |
| 1974 | 6.054.240.000 US$ | 7.029.800.203 US$ |
| 1973 | 4.650.160.000 US$ | 2.378.672.829 US$ |
| 1972 | 3.643.200.000 US$ | 1.519.074.797 US$ |
| 1971 | 2.995.040.000 US$ | 1.687.411.598 US$ |
| 1970 | 2.754.440.000 US$ | 1.224.999.510 US$ |
| 1969 | 2.451.096.000 US$ | - |
| 1968 | 2.066.336.000 US$ | - |
| 1967 | 1.824.072.000 US$ | - |
| 1966 | 1.816.952.000 US$ | - |
| 1965 | 1.667.320.000 US$ | - |
| 1964 | 1.532.720.000 US$ | - |
| 1963 | 1.411.096.000 US$ | - |
| 1962 | 1.302.504.000 US$ | - |
| 1961 | 1.191.208.000 US$ | - |
| 1960 | 1.109.120.000 US$ | - |
En 2025, las exportaciones de bienes y servicios de México fueron de 727 mil millones de US$ y las de Irak, de 103 mil millones de US$: las de México fueron 7,1 veces mayores. En 1970, las exportaciones de México fueron 2,2 veces mayores: 2,75 mil millones de US$ de México y 1,22 mil millones de US$ de Irak.
Las exportaciones de bienes y servicios de México han sido mayores que las de Irak todos los años desde 1981.
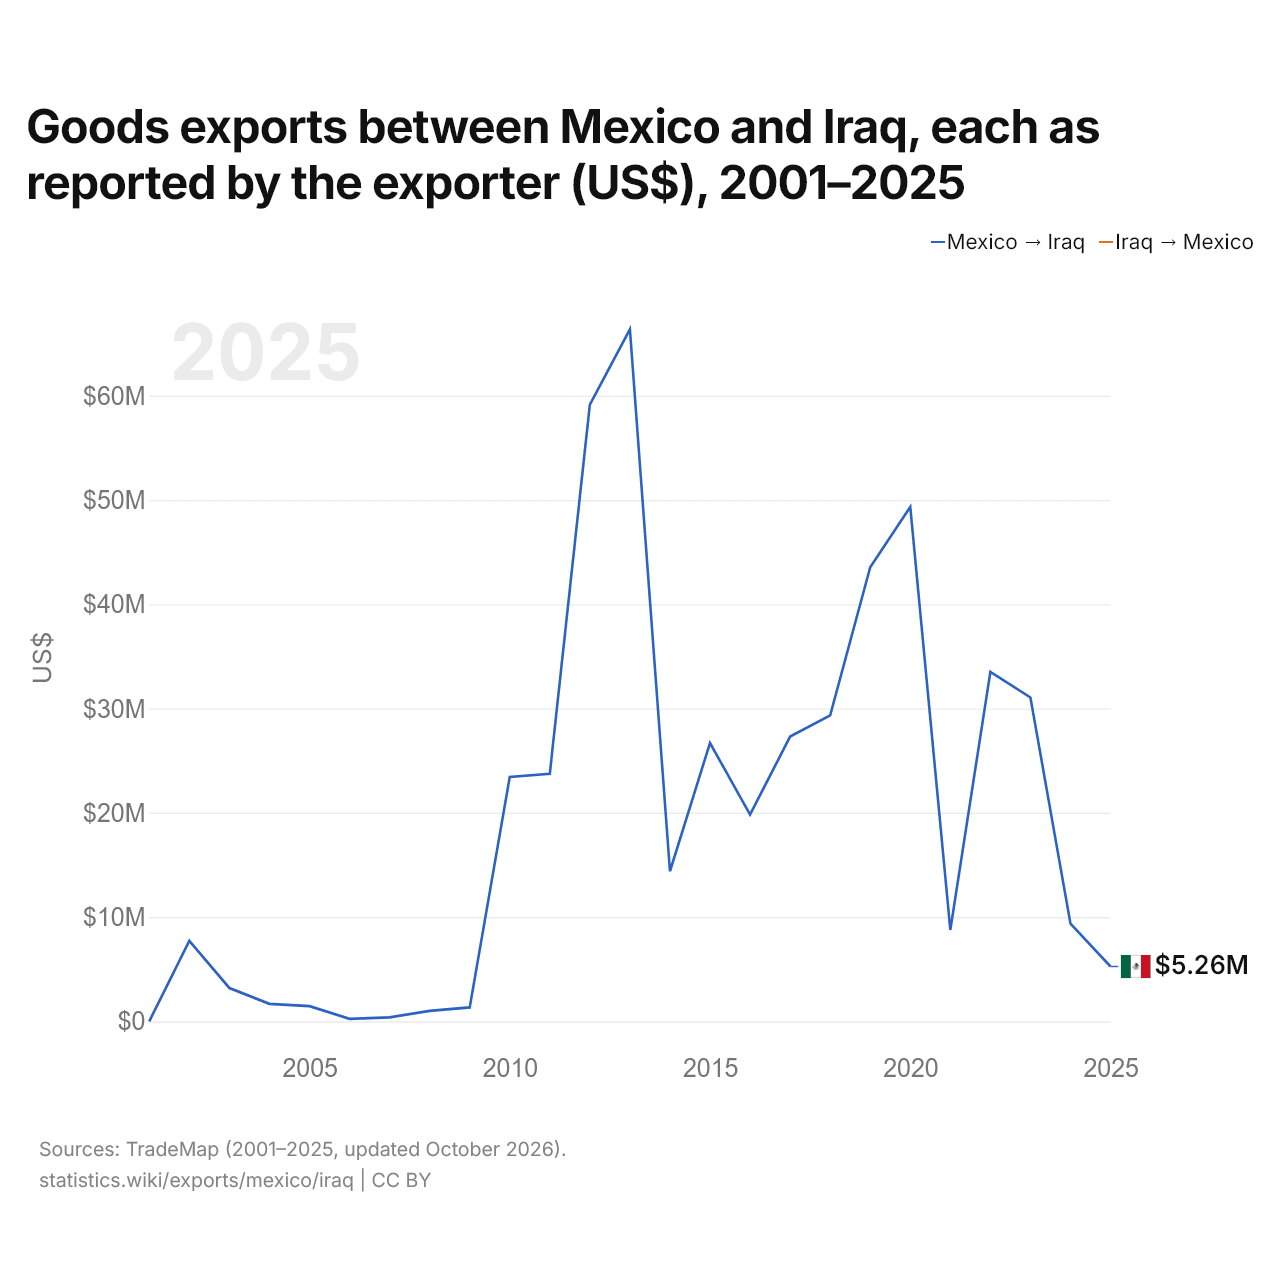
Exportaciones de bienes entre México y Irak, según declara el exportador (US$), 2001–2025
| Año | US$ | |
|---|---|---|
| México → Irak | Irak → México | |
| 2025 | 5.259.000 US$ | - |
| 2024 | 9.362.000 US$ | - |
| 2023 | 31.059.000 US$ | - |
| 2022 | 33.513.000 US$ | - |
| 2021 | 8.767.000 US$ | - |
| 2020 | 49.337.000 US$ | - |
| 2019 | 43.547.000 US$ | - |
| 2018 | 29.344.000 US$ | - |
| 2017 | 27.306.000 US$ | - |
| 2016 | 19.828.000 US$ | - |
| 2015 | 26.694.000 US$ | - |
| 2014 | 14.392.000 US$ | - |
| 2013 | 66.370.000 US$ | - |
| 2012 | 59.142.000 US$ | - |
| 2011 | 23.743.000 US$ | - |
| 2010 | 23.438.000 US$ | - |
| 2009 | 1.337.000 US$ | - |
| 2008 | 1.009.000 US$ | - |
| 2007 | 381.000 US$ | - |
| 2006 | 242.000 US$ | - |
| 2005 | 1.454.000 US$ | - |
| 2004 | 1.676.000 US$ | - |
| 2003 | 3.197.000 US$ | - |
| 2002 | 7.713.000 US$ | - |
| 2001 | 3.000 US$ | - |
Según México, sus exportaciones de bienes hacia Irak fueron de 5,26 millones de US$ en 2025, frente a 3000 US$ en 2001.
México vs Irak: cifras de exportaciones
|
México
|
Irak
|
|
|---|---|---|
| Exportaciones | 727 mil M US$ (2025) | 103 mil M US$ (2025) |
| Puesto mundial | 15/176 | 48/176 |
| Porcentaje del mundo | 2,08 % | 0,29 % |
| % del PIB | 39,6 % | 40,5 % |
| Mayor categoría de bienes | Maquinaria, electrónica y vehículos (70,3 %, 2025) | Petróleo, gas, minerales y otras materias primas (99,1 %, 2024) |
| Principal destino de bienes | Estados Unidos (81,9 %, 2025) | Emiratos Árabes Unidos (3,61 %, 2024) |
Comparar las exportaciones de 2 países cualesquiera
Fuentes:
- Banco Mundial | Economía y crecimiento (1960–2025, actualizado en octubre de 2026)
- TradeMap (2001–2025, actualizado en octubre de 2026)
Creative Commons Atribución (CC BY): puedes copiar, compartir, adaptar y reutilizar este contenido, también con fines comerciales, siempre que cites a statistics.wiki e indiques los cambios que hayas hecho. Las fuentes indicadas arriba pueden tener sus propias condiciones de licencia.