
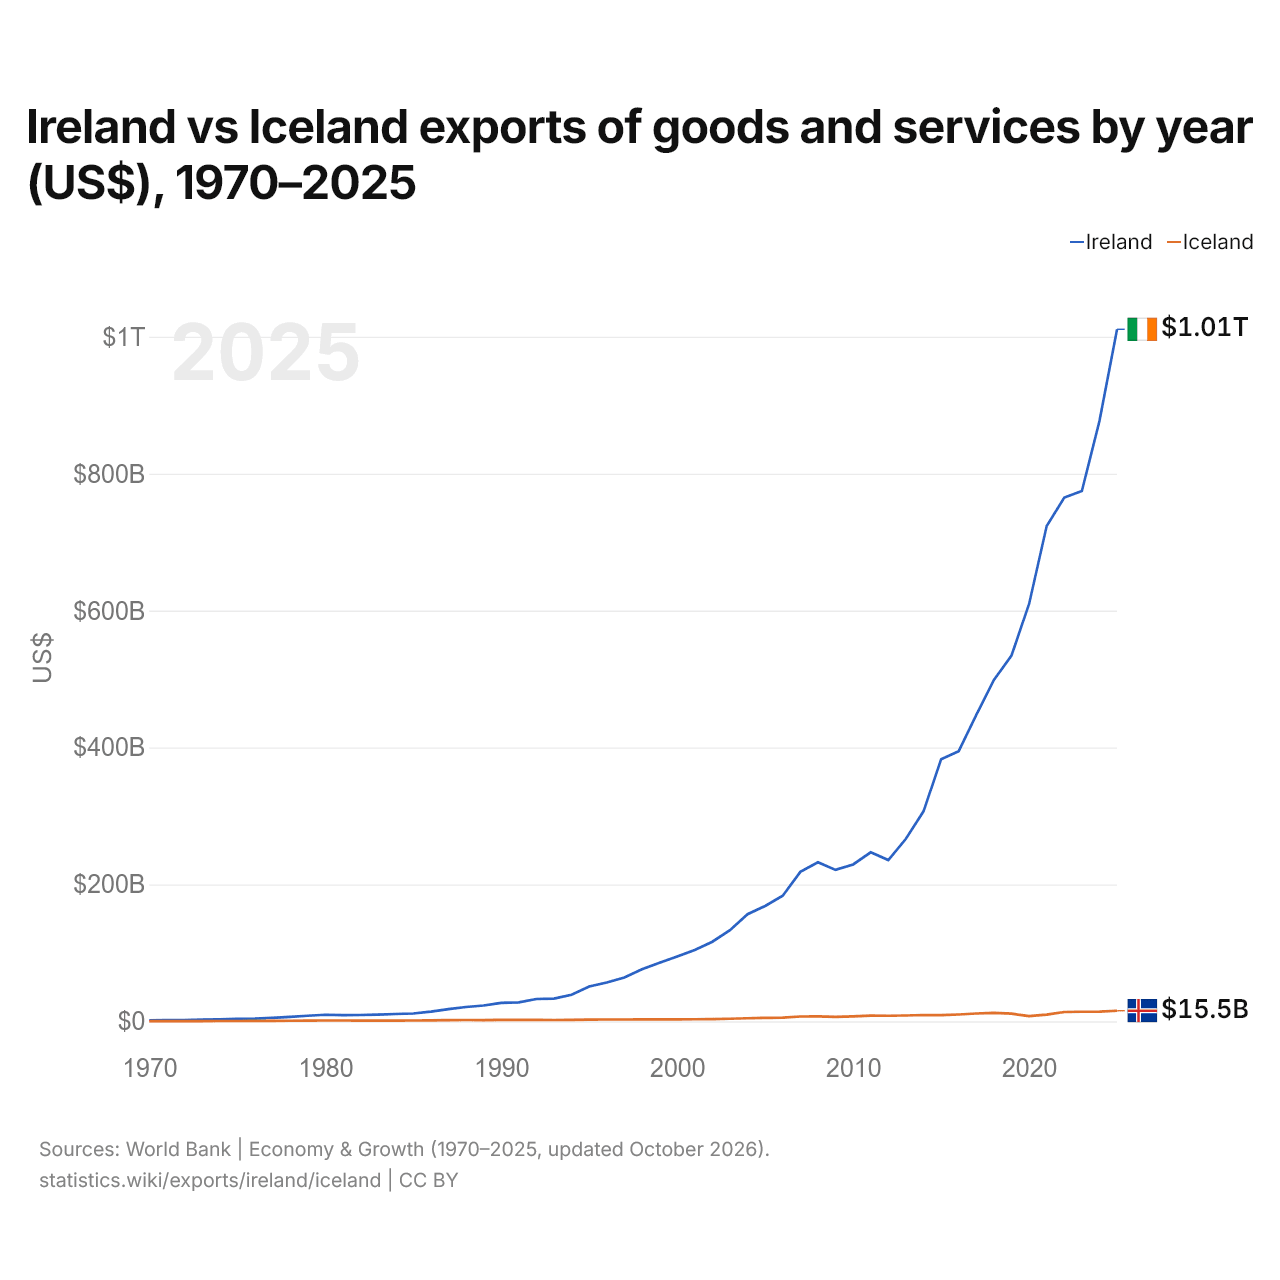
Irlanda vs Islandia: exportaciones de bienes y servicios por año (US$), 1970–2025
| Año | US$ | |
|---|---|---|
 Irlanda |
 Islandia |
|
| 2025 | 1.010.863.026.885 US$ | 15.476.918.000 US$ |
| 2024 | 877.092.941.905 US$ | 14.090.127.915 US$ |
| 2023 | 774.613.383.952 US$ | 13.940.823.776 US$ |
| 2022 | 764.969.597.259 US$ | 13.632.709.462 US$ |
| 2021 | 723.445.227.903 US$ | 9.802.647.461 US$ |
| 2020 | 609.592.461.958 US$ | 7.522.355.306 US$ |
| 2019 | 534.361.678.398 US$ | 11.172.065.684 US$ |
| 2018 | 498.559.384.825 US$ | 12.397.616.650 US$ |
| 2017 | 447.623.457.263 US$ | 11.445.214.118 US$ |
| 2016 | 394.551.308.719 US$ | 10.012.449.483 US$ |
| 2015 | 382.724.762.971 US$ | 9.086.505.055 US$ |
| 2014 | 306.723.211.567 US$ | 9.191.034.651 US$ |
| 2013 | 266.600.810.534 US$ | 8.580.915.713 US$ |
| 2012 | 235.594.088.469 US$ | 8.097.199.624 US$ |
| 2011 | 246.785.523.404 US$ | 8.306.196.645 US$ |
| 2010 | 229.110.049.419 US$ | 7.121.350.039 US$ |
| 2009 | 221.207.094.301 US$ | 6.408.804.967 US$ |
| 2008 | 232.293.869.047 US$ | 7.284.145.795 US$ |
| 2007 | 218.323.414.732 US$ | 7.110.704.785 US$ |
| 2006 | 183.503.168.969 US$ | 5.310.428.256 US$ |
| 2005 | 168.500.867.903 US$ | 5.116.287.715 US$ |
| 2004 | 156.422.059.727 US$ | 4.480.777.642 US$ |
| 2003 | 133.120.814.360 US$ | 3.728.493.371 US$ |
| 2002 | 116.314.428.261 US$ | 3.309.446.650 US$ |
| 2001 | 104.124.679.774 US$ | 3.042.019.192 US$ |
| 2000 | 94.585.397.045 US$ | 2.899.936.222 US$ |
| 1999 | 85.503.791.297 US$ | 2.915.299.612 US$ |
| 1998 | 76.059.795.895 US$ | 2.871.539.298 US$ |
| 1997 | 63.903.008.596 US$ | 2.689.829.672 US$ |
| 1996 | 56.772.605.847 US$ | 2.658.458.135 US$ |
| 1995 | 50.831.584.596 US$ | 2.493.202.436 US$ |
| 1994 | 38.803.585.395 US$ | 2.251.420.757 US$ |
| 1993 | 33.215.365.740 US$ | 2.007.806.139 US$ |
| 1992 | 32.659.481.442 US$ | 2.113.685.423 US$ |
| 1991 | 27.672.807.707 US$ | 2.130.770.692 US$ |
| 1990 | 26.973.247.362 US$ | 2.144.153.418 US$ |
| 1989 | 23.122.490.233 US$ | 1.873.815.640 US$ |
| 1988 | 20.998.862.627 US$ | 1.910.725.694 US$ |
| 1987 | 17.787.856.976 US$ | 1.864.331.518 US$ |
| 1986 | 14.098.603.222 US$ | 1.516.684.791 US$ |
| 1985 | 11.493.857.750 US$ | 1.183.251.903 US$ |
| 1984 | 10.718.897.046 US$ | 1.072.642.449 US$ |
| 1983 | 9.750.540.276 US$ | 1.081.525.794 US$ |
| 1982 | 9.241.993.070 US$ | 1.016.617.901 US$ |
| 1981 | 8.965.729.497 US$ | 1.191.331.358 US$ |
| 1980 | 9.647.826.509 US$ | 1.182.341.379 US$ |
| 1979 | 8.154.121.534 US$ | 1.066.704.197 US$ |
| 1978 | 6.547.731.803 US$ | 903.769.319 US$ |
| 1977 | 4.973.657.096 US$ | 716.305.627 US$ |
| 1976 | 3.914.804.699 US$ | 568.047.977 US$ |
| 1975 | 3.624.897.213 US$ | 461.359.141 US$ |
| 1974 | 3.009.300.313 US$ | 468.893.447 US$ |
| 1973 | 2.545.049.199 US$ | 404.493.509 US$ |
| 1972 | 1.954.551.534 US$ | 289.636.302 US$ |
| 1971 | 1.647.964.737 US$ | 247.179.545 US$ |
| 1970 | 1.454.713.665 US$ | 233.403.409 US$ |
En 2025, las exportaciones de bienes y servicios de Irlanda fueron de 1,01 billones de US$ y las de Islandia, de 15,5 mil millones de US$: las de Irlanda fueron 65 veces mayores. En 1970, las exportaciones de Irlanda fueron 6,2 veces mayores: 1,45 mil millones de US$ de Irlanda y 233 millones de US$ de Islandia.
Las exportaciones de bienes y servicios de Irlanda han sido mayores que las de Islandia todos los años desde 1970.
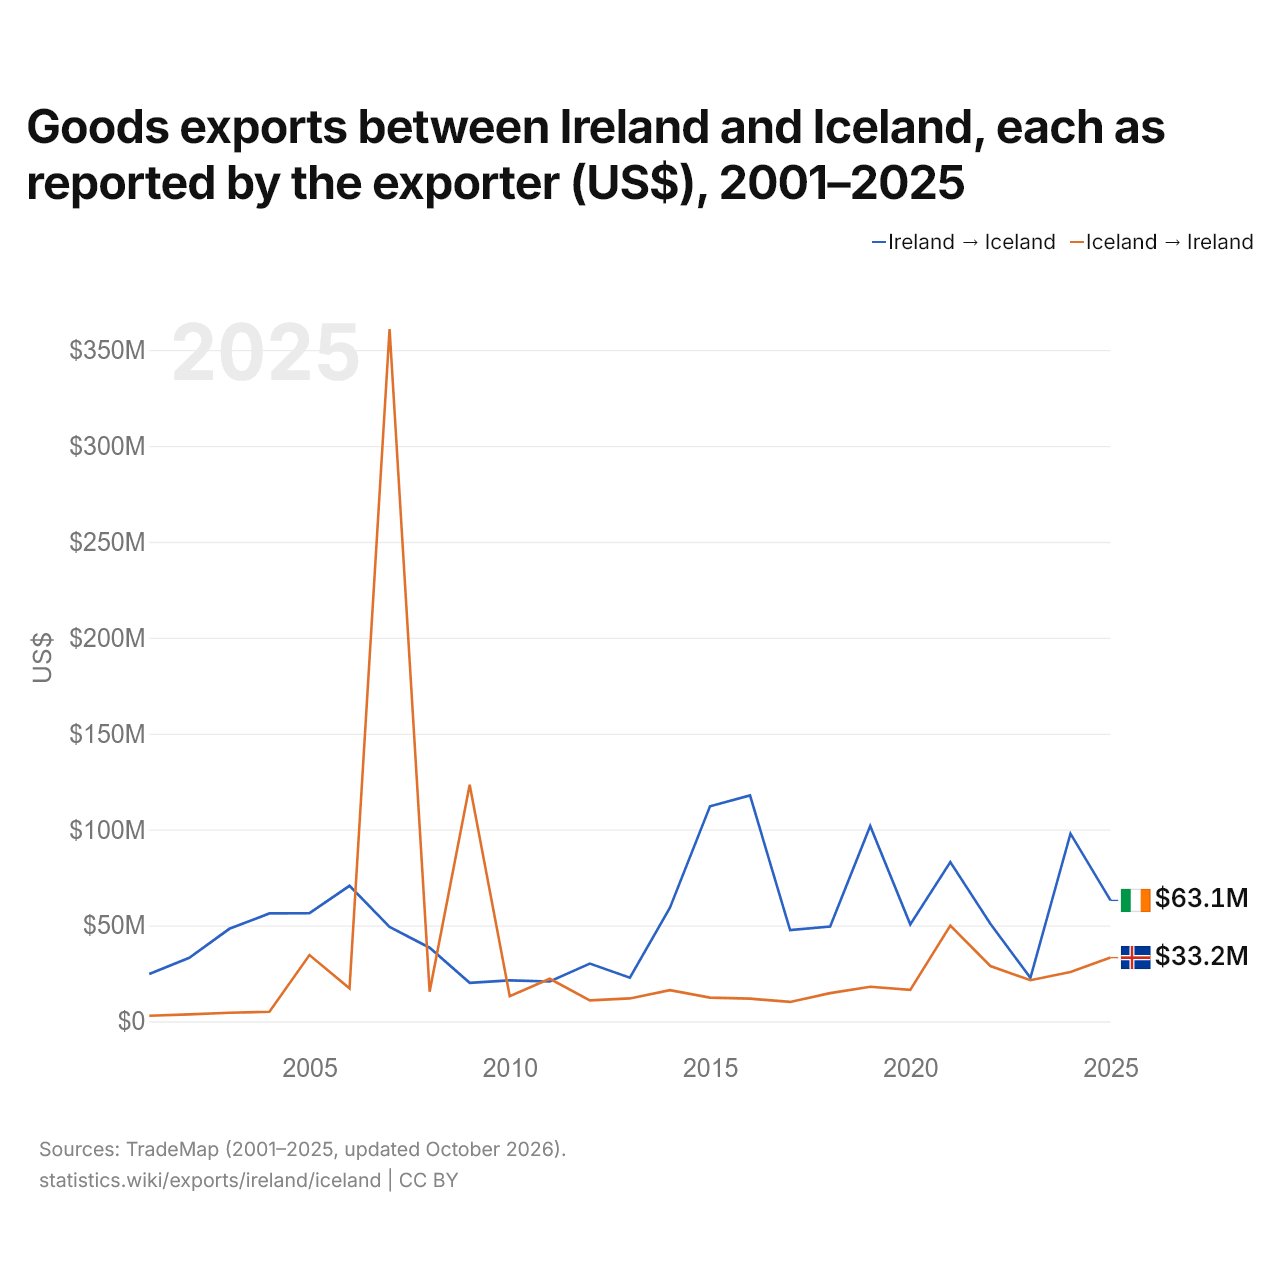
Exportaciones de bienes entre Irlanda y Islandia, según declara el exportador (US$), 2001–2025
| Año | US$ | |
|---|---|---|
| Irlanda → Islandia | Islandia → Irlanda | |
| 2025 | 63.051.000 US$ | 33.222.000 US$ |
| 2024 | 97.849.000 US$ | 25.751.000 US$ |
| 2023 | 22.642.000 US$ | 21.431.000 US$ |
| 2022 | 50.849.000 US$ | 28.832.000 US$ |
| 2021 | 83.021.000 US$ | 49.916.000 US$ |
| 2020 | 50.549.000 US$ | 16.366.000 US$ |
| 2019 | 101.869.000 US$ | 18.010.000 US$ |
| 2018 | 49.383.000 US$ | 14.725.000 US$ |
| 2017 | 47.538.000 US$ | 10.110.000 US$ |
| 2016 | 117.751.000 US$ | 11.801.000 US$ |
| 2015 | 112.100.000 US$ | 12.378.000 US$ |
| 2014 | 59.250.000 US$ | 16.262.000 US$ |
| 2013 | 22.719.000 US$ | 11.930.000 US$ |
| 2012 | 30.124.000 US$ | 10.895.000 US$ |
| 2011 | 20.777.000 US$ | 22.228.000 US$ |
| 2010 | 21.383.000 US$ | 13.113.000 US$ |
| 2009 | 20.046.000 US$ | 123.351.000 US$ |
| 2008 | 38.387.000 US$ | 15.489.000 US$ |
| 2007 | 49.246.000 US$ | 360.957.000 US$ |
| 2006 | 70.661.000 US$ | 17.187.000 US$ |
| 2005 | 56.393.000 US$ | 34.558.000 US$ |
| 2004 | 56.284.000 US$ | 5.013.000 US$ |
| 2003 | 48.242.000 US$ | 4.470.000 US$ |
| 2002 | 33.123.000 US$ | 3.590.000 US$ |
| 2001 | 24.672.000 US$ | 2.918.000 US$ |
En 2025, las exportaciones de bienes de Irlanda hacia Islandia, según Irlanda, fueron de 63,1 millones de US$, y las de Islandia hacia Irlanda, según Islandia, de 33,2 millones de US$: 1,9 veces más desde Irlanda. En 2001, fueron de 24,7 millones de US$ desde Irlanda y de 2,92 millones de US$ desde Islandia.
Irlanda vs Islandia: cifras de exportaciones
|
Irlanda
|
Islandia
|
|
|---|---|---|
| Exportaciones | 1,01 B US$ (2025) | 15,5 mil M US$ (2025) |
| Puesto mundial | 8/176 | 96/176 |
| Porcentaje del mundo | 2,9 % | 0,04 % |
| % del PIB | 140,1 % | 40,1 % |
| Mayor categoría de bienes | Productos químicos, farmacéuticos y plásticos (67,2 %, 2025) | Animales, carne, pescado, lácteos, cueros y pieles (40,5 %, 2025) |
| Principal destino de bienes | Estados Unidos (42,5 %, 2025) | Países Bajos (34,4 %, 2025) |
Comparar las exportaciones de 2 países cualesquiera
Fuentes:
- Banco Mundial | Economía y crecimiento (1970–2025, actualizado en octubre de 2026)
- TradeMap (2001–2025, actualizado en octubre de 2026)
Creative Commons Atribución (CC BY): puedes copiar, compartir, adaptar y reutilizar este contenido, también con fines comerciales, siempre que cites a statistics.wiki e indiques los cambios que hayas hecho. Las fuentes indicadas arriba pueden tener sus propias condiciones de licencia.